SanDisk Enters SSD High-Speed Field - Extreme 240GB with PC/NB Test In my impression, SanDisk is well known brand in Taiwan for years. My first SanDisk product was CF card for digital SLR camera. After another, I also used or researched other brands CF and SD card. I think memory card is key field of SanDisk. SanDisk has wide range product lines of high spec. memory card. Its also one of few brands to have SLC products. Previously, I saw some SanDisk SSD products from internet were SATA2 and mSATA. I felt they more focus on NoteBook and didnt see any SATA3 high bandwidth product yet. However, in March, I started to see more news about SanDisk SATA3 SSD in internet and market. For current competitive SSD market, launching SSD this stage needs to own real strength and right position. First of all, lets look at SanDisk Extreme SSD packing. Its same design style with his memory card. The simple design uses black as main color to combine with red lines or characters. 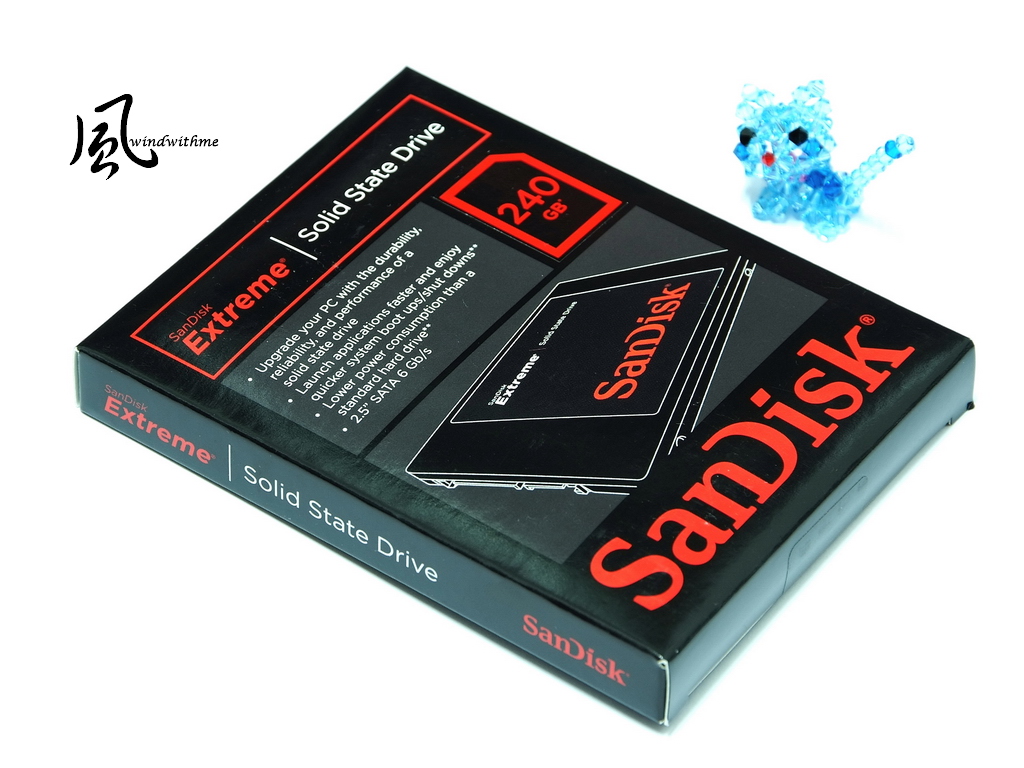 Contents Left side is SanDisk Extreme 240GB and sticker. Right side is multi-languages products manual. If they can bundle 2.5 to 3.5 adapter, that would be better. 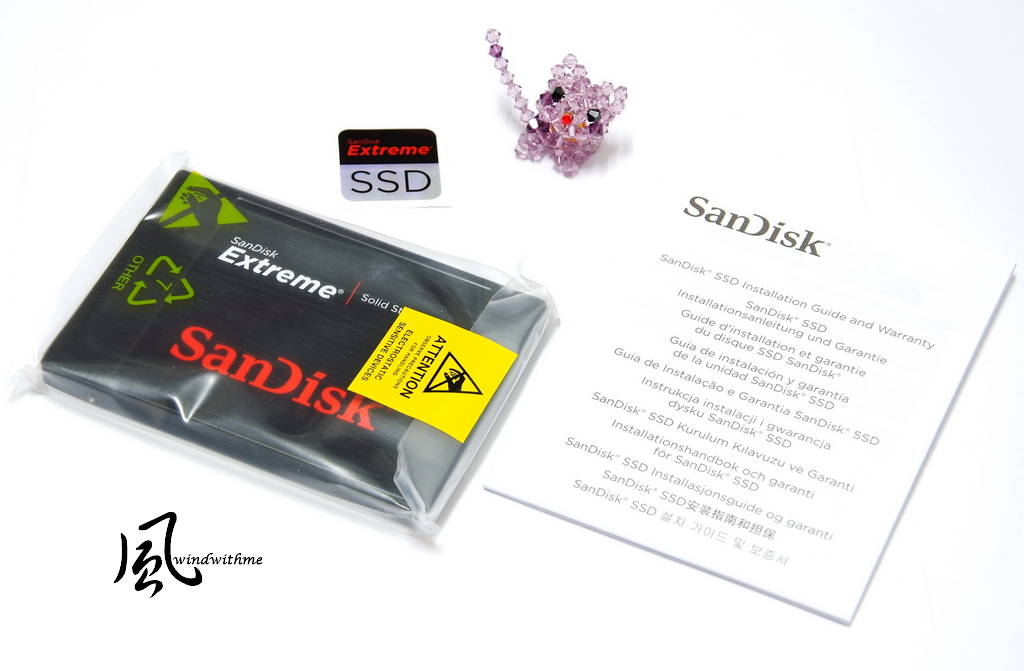 Its 2.5 and the capacity is 240GB. In official spec, max Sequential Read/Write is 550/520 MB/s. Max random Read/ Write is 39K/83K IOPS. Its the SATA3 SSD highest spec in the market so far.  The model name is SDSSDX-240G-G25. This series has 120, 240 and 480GB. Its glossy black metal shell. The texture of outlook is elegant. Controller chip is SandForce SF-2281. This chip has launched almost one year. Many major brands SSD are also using SF-2281.  Backside sticker shows all safety certificate and information. The screws are under sticker which is different with general design. If you want to see controller and NAND Flash inside, you can search the pictures from internet. As warranty and hardware safety, I recommend you to keep it as original. 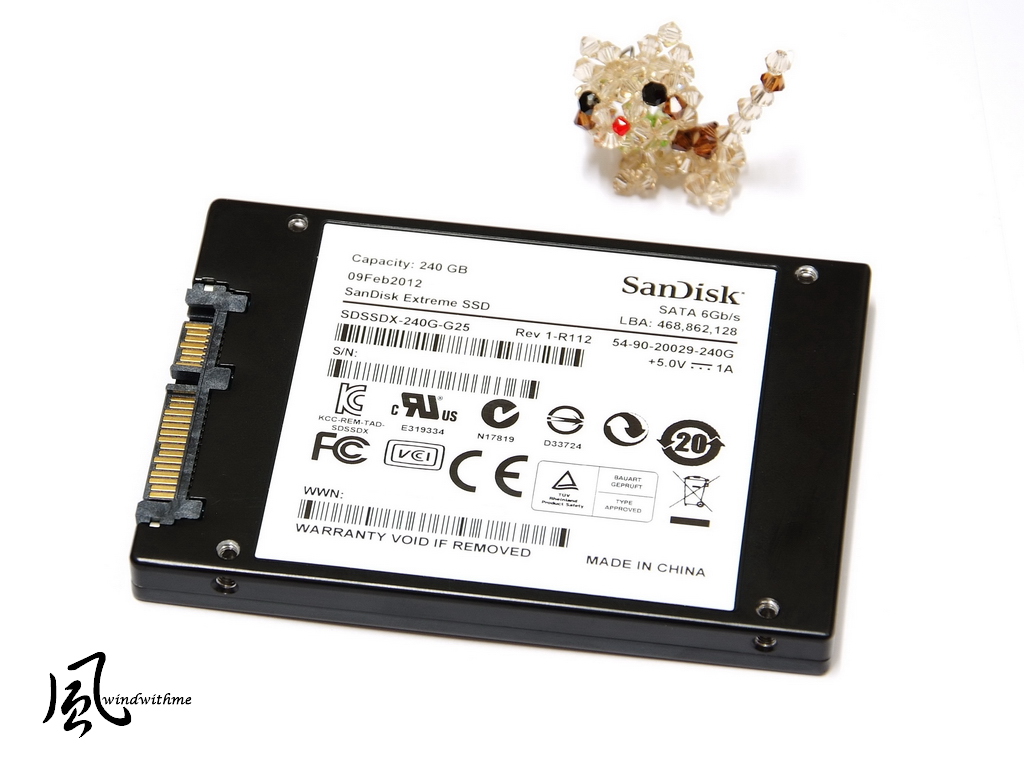 Lower right is SATA3 and power connector. Its same as SATA1 or SATA2. You need to check the packing or product spec to know if its SATA3 SSD.  Screw holes are 2.5 standard. It supports NoteBook. Now, many PC Case also support 2.5 rack. 2.5 to 3.5 adaptor is not really necessary for PC users. 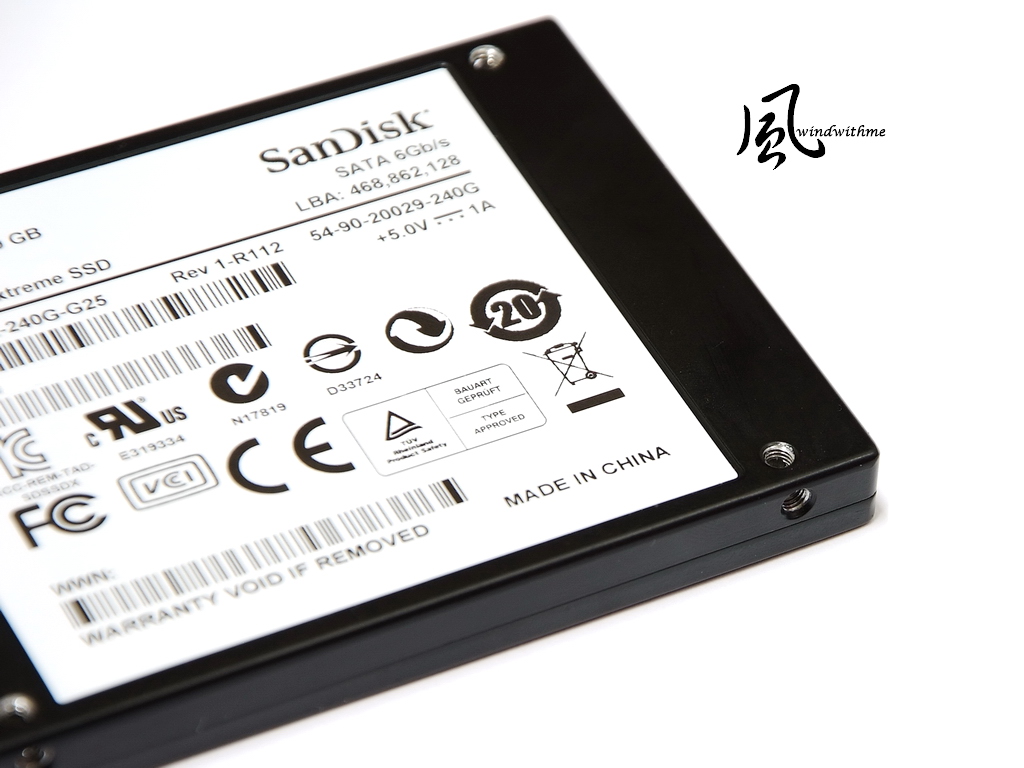 SanDisk Extreme uses SandForce SF-2281 controller. Its very popular SATA3 SSD controller. It uses anDisk 24nm Synchronize NAND Flash. The individual IC is 32GB. NAND Flash IC is very special. Normally, SandForce SF-2281 bundles with Intel or Micron IC. For the performance, lets follow on the test result below. First, I use Intel DeskTop platform. Its GIGABYTE latest Z77X-UD5H-WB WIFI. It supprts 3 PCI-E X16, 3 PCI-E X1 and 1 PCI. Its good extensibility in ATX size. 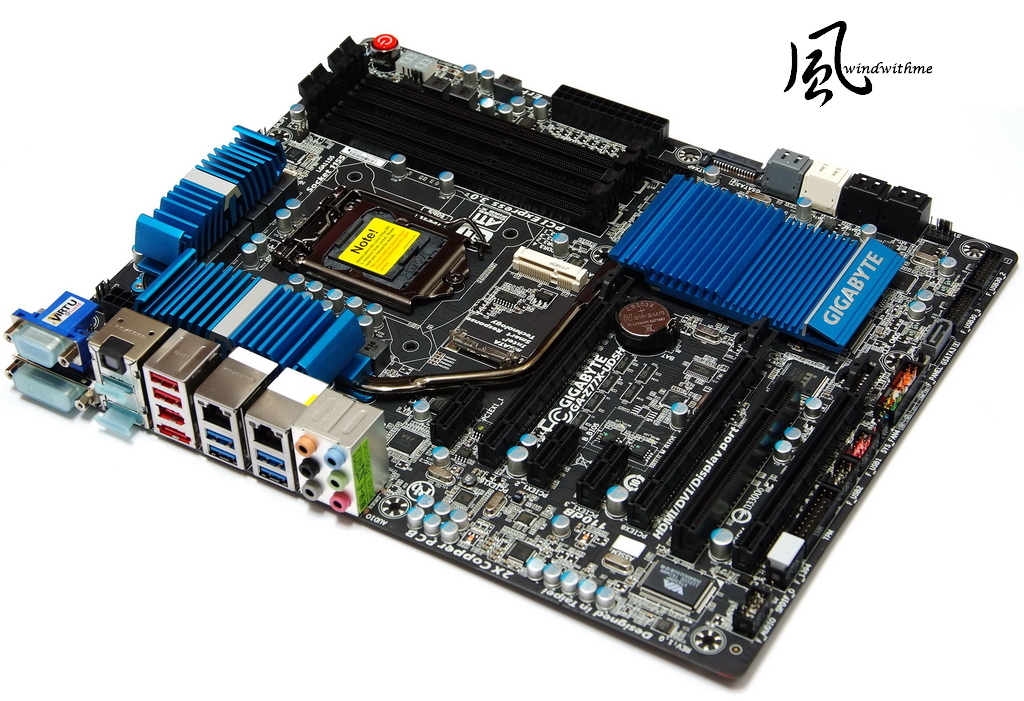 Z77 built-in GPU supports simultaneously three outputs. Its also first time native support USB 3.0. Exclusive BT4.0 and Wi-Fi PCI-E card enhance connection between PC and mobile devices indoor. 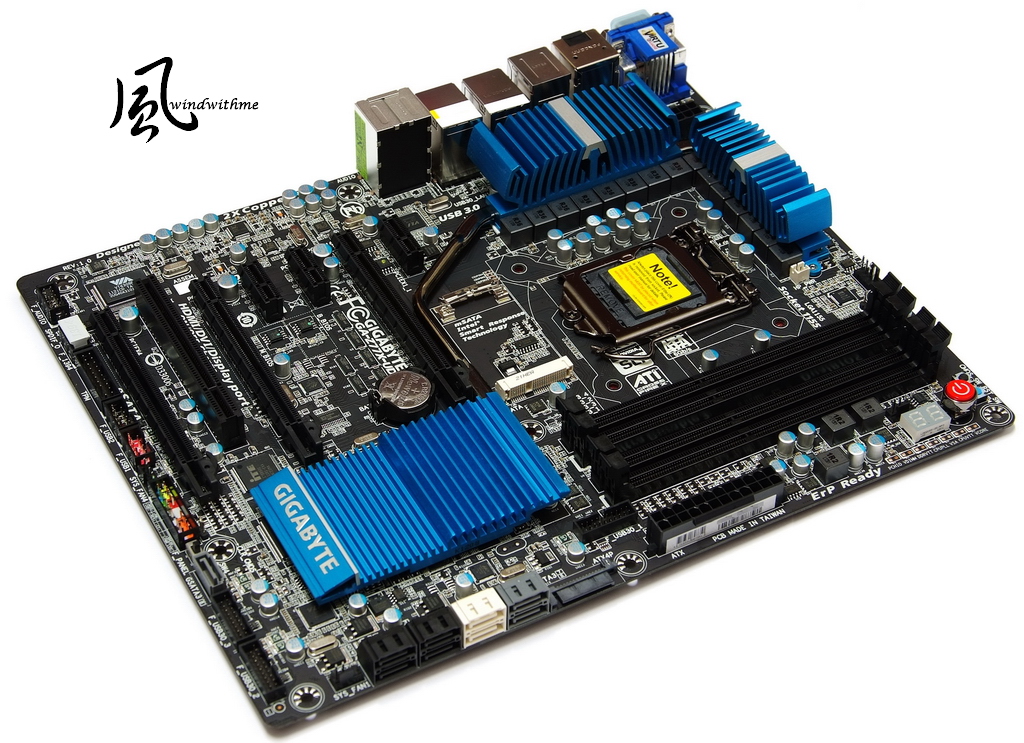 Intel Z77 is latest mid to high end chipset. Its getting popular. Intel chipset always gets better I/O transfer rate. SATA3 SSD can have better performance on it. Test Configuration CPU: Intel Core i7-3770K MB: Z77X-UD5H-WB WIFI DRAM: CORSAIR DOMINATOR-GT CMT16GX3M4X2133C9 VGA: Intel HD Graphics 4000 HD: SanDisk Extreme 240GB / TOSHIBA 750GB POWER: CORSAIR AX650W Cooler: Intel Original Cooler OS: Windows7 Ultimate 64bit Single SanDisk Extreme 240GB install at white SATA3. I set it as non-OS drive without any data to test performance on Intel Z77 platform. HD Tune Pro 5.00 Black Size is special function of this software. Left side is default 64K and right side is 1MB. 64K - Read - Average 339.5 MB/s Access Time 0.134ms 1MB - Read - Average 516.0 MB/s Access Time 0.135ms 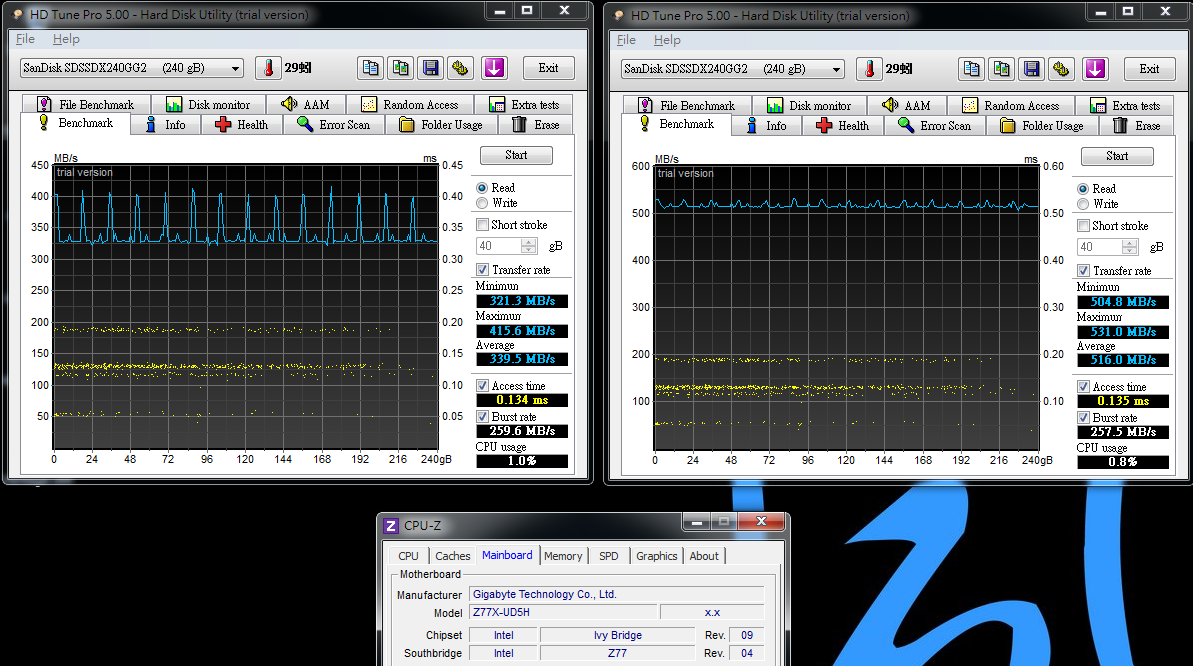 |
HD Tune Pro 5.00 set Black Size as 1MB can have the best performance. 64K - Write - Average 282.9 MB/s Access Time 0.099ms 1MB - Write - Average 335.2 MB/s Access Time 0.177ms 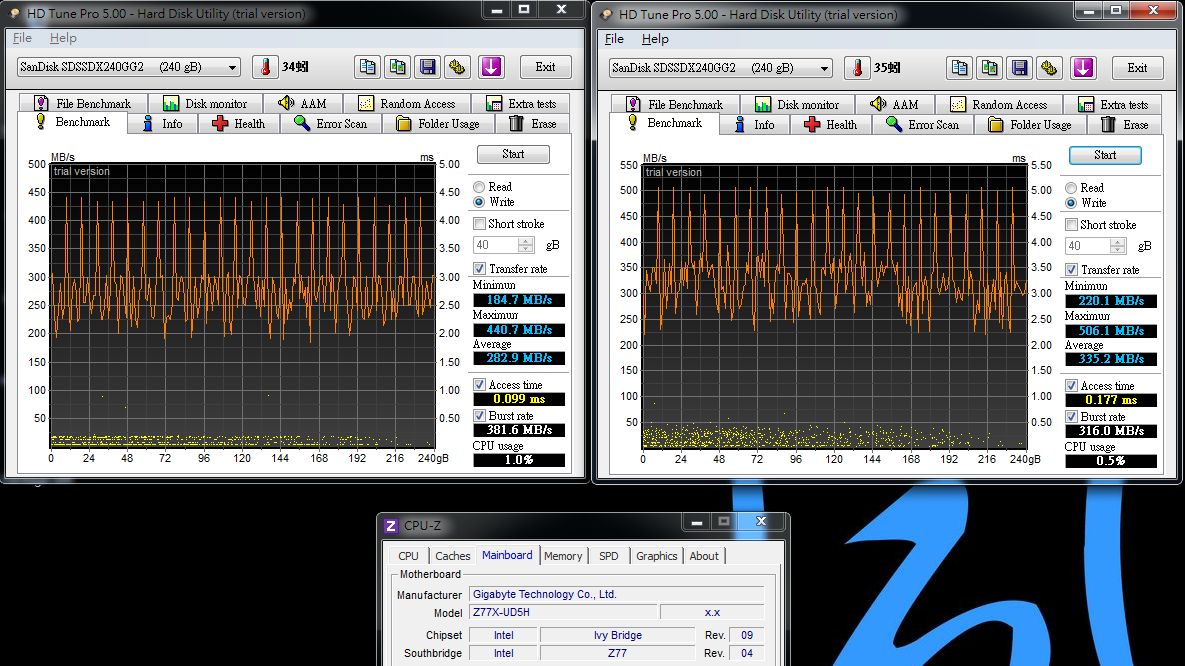 Read - Random Access & Extra tests 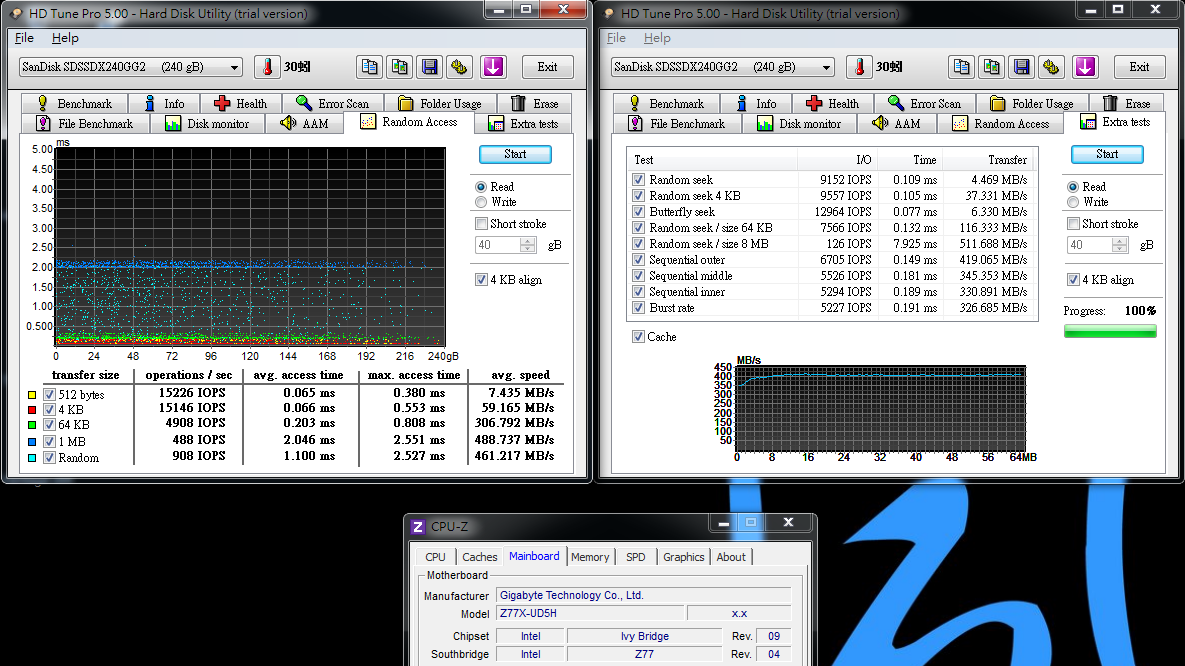 Write - Random Access & Extra tests 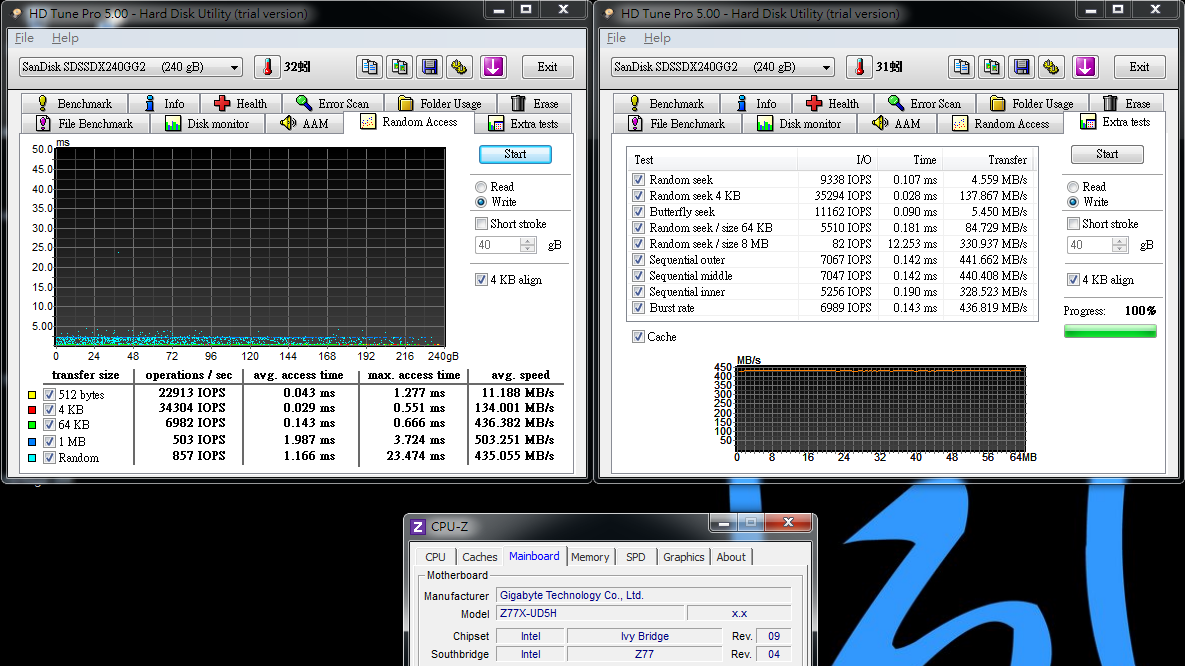 File Benchmark Sequential Read - 60431 IOPS / Write - 911977 IOPS ATTO DISK Benchmark over 512k test, max Read is 559.2 Mb/s and Write is 535.6 MB/s 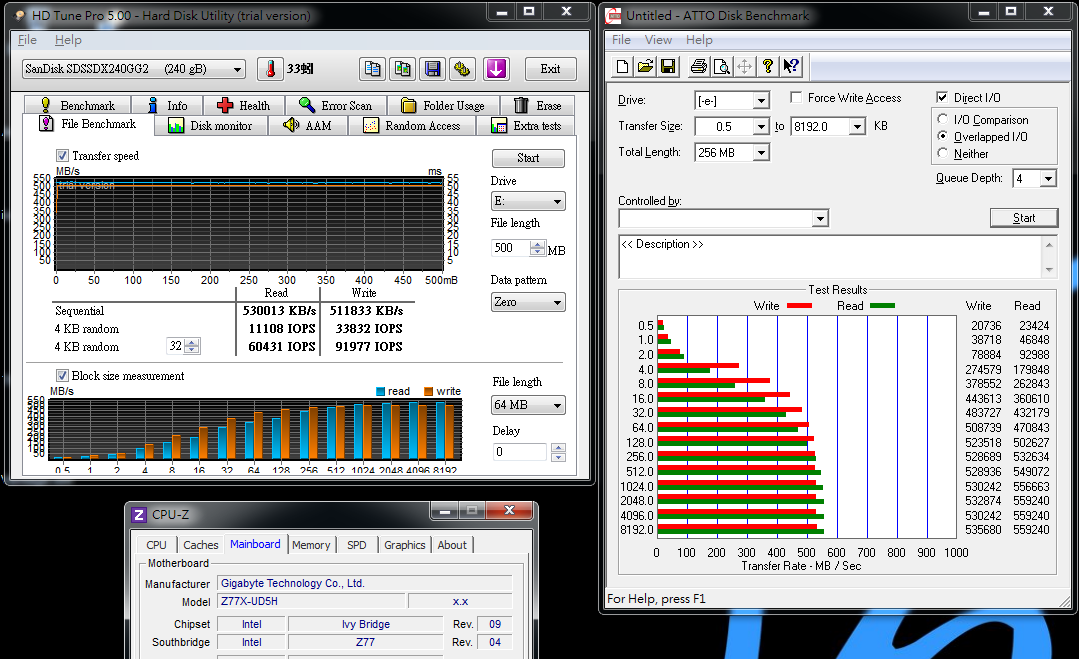 HD Tune Pro 5.00 revises File Benchmark to be more detail. There are more paramaters for reference. ATTO DISK Benchmark test result is over official Read 550 and Write 520 MB/s. CrystalDiskMark Seq Read - 524.6 MB/s Write - 298.3 MB/s <All 0xFF, 0Fill> Read - 530.0 MB/s Write - 525.7 MB/s <All 0x00, 1Fill> Read - 529.6 MB/s Write - 525.7 MB/s 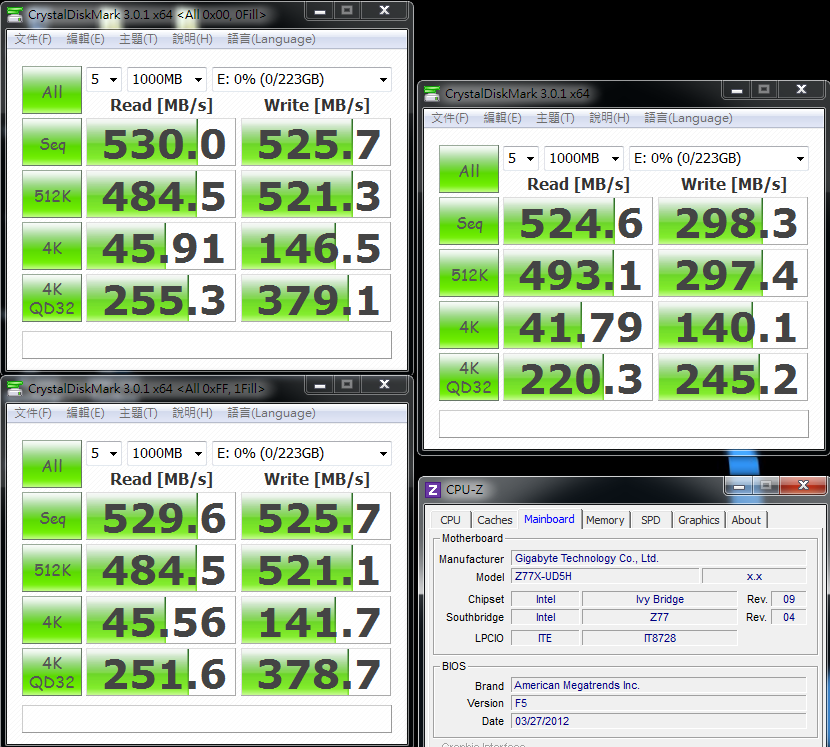 CrystalDiskMark default test is random, As right-hand picture, the Write performance is lower. This part is caused by SandForce controller structure. The performance will be lower as algorithm. Left side CrystalDiskMark test changes to two pure sequential mode. The Write is close to official spec. SandForce has special algorithm in Sequential Write. The speed starts from 280MB/s and ramp to 500 MB/s slowly. This is also a weakness of SandForce controller. AS SSD Benchmark - 824 Seq Read - 519.10 MB/s Write - 280.41 MB/s 4K - 64Thrd Read - 227.01 MB/s Write - 222.52 MB/s 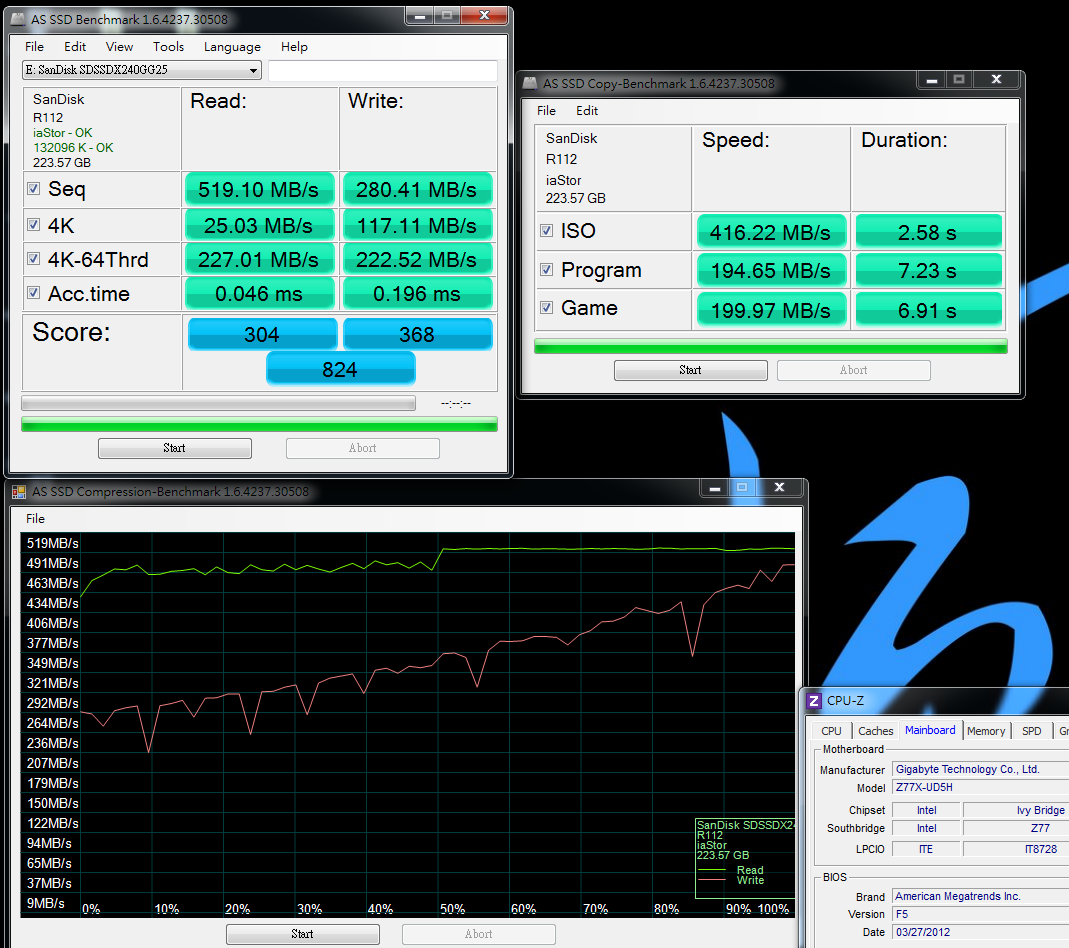 SandForce structure will be changed by SSD capacity. AS SSD Benchmark with 120GB is only 500, but it improves to 700~800 with 240GB. You can see 240GB Write Seq/4K-64Thrd is much better than 120GB. AS SSD Benchmark in personal experience, the ratio is more on 4K and 4K-64Thrd. In these 2 items, if the transfer rate is higher, the total will be higher as well. PCMark Vantage - HDD Score : 85720 CrystalMark Sequential Read 505.88 MB/s Sequential Write 501.55 MB/s 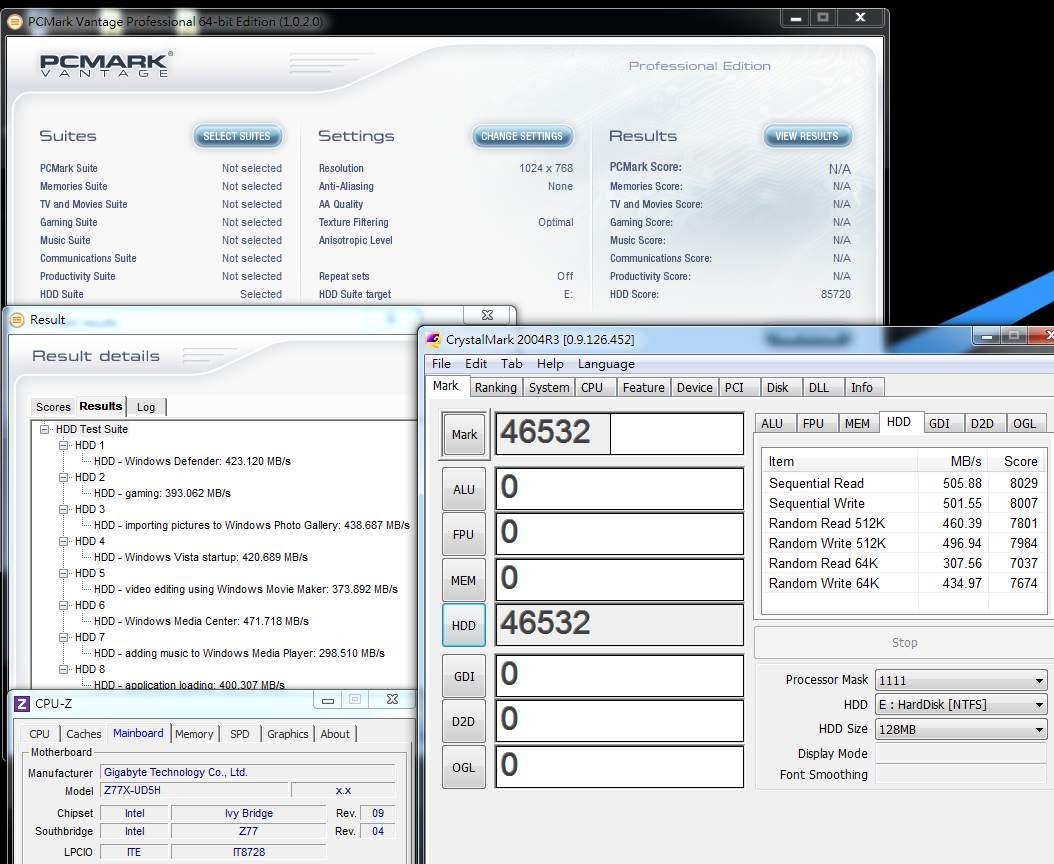 IOMETER 2008 1 minute - 100% Read / 100% Random 4KB Total I/Os per Second 57420.61 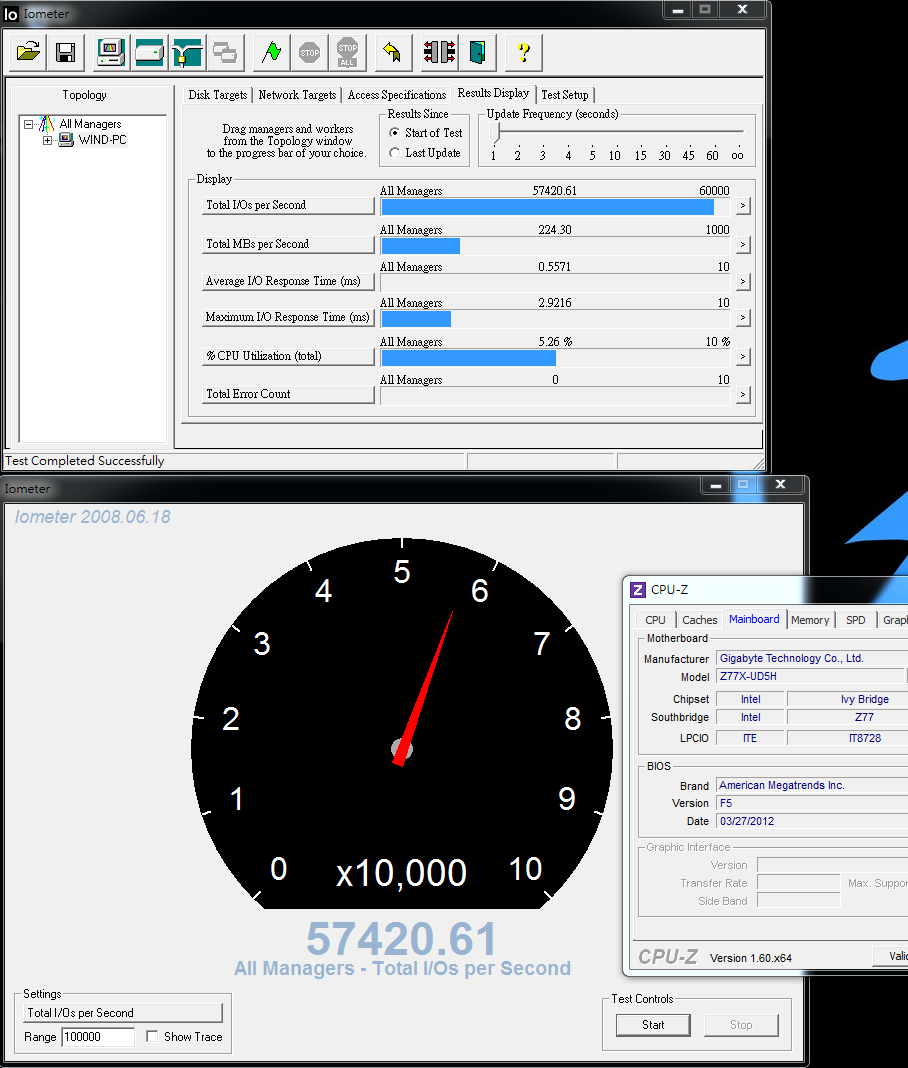 3 minutes - 100% Read / 100% Random 4KB Total I/Os per Second 56000.22 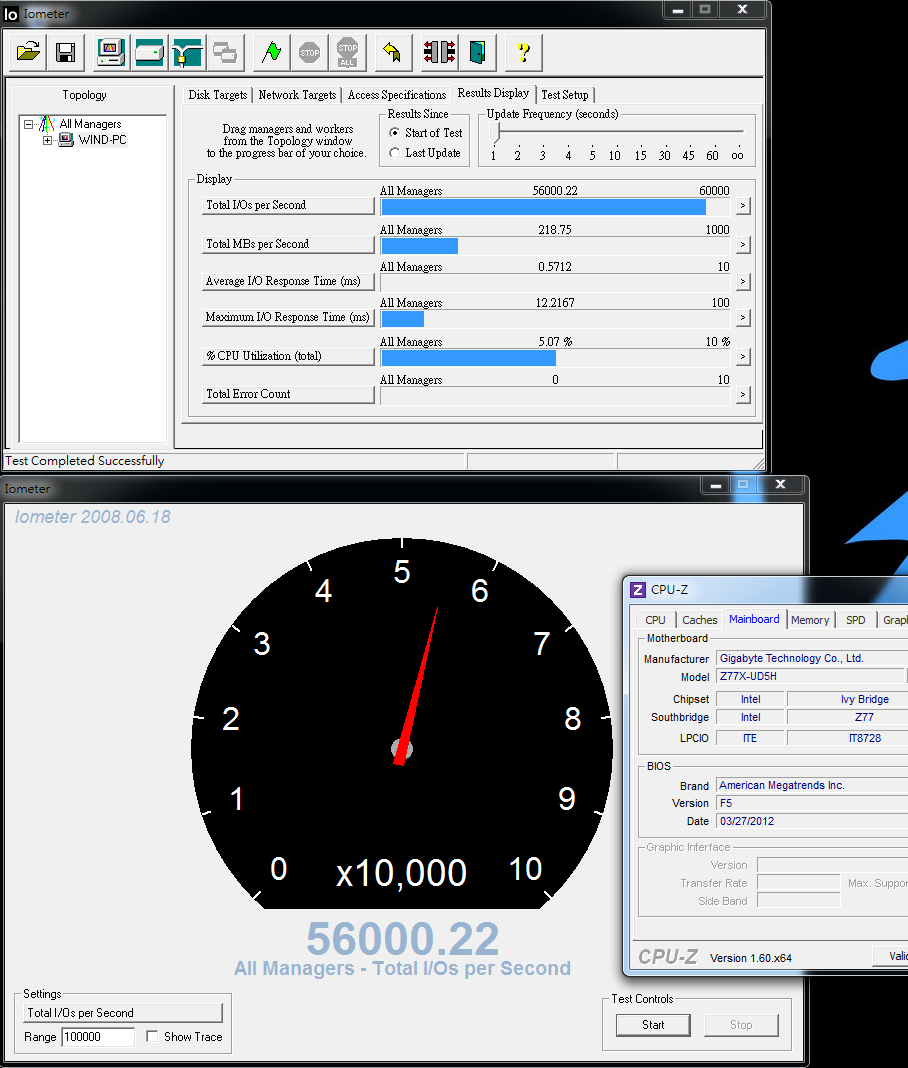 1 minute - 100% Write / 100% Random 4KB Total I/Os per Second 91930.96  |
3 minutes - 100% Write / 100% Random 4KB Total I/Os per Second 85981.10 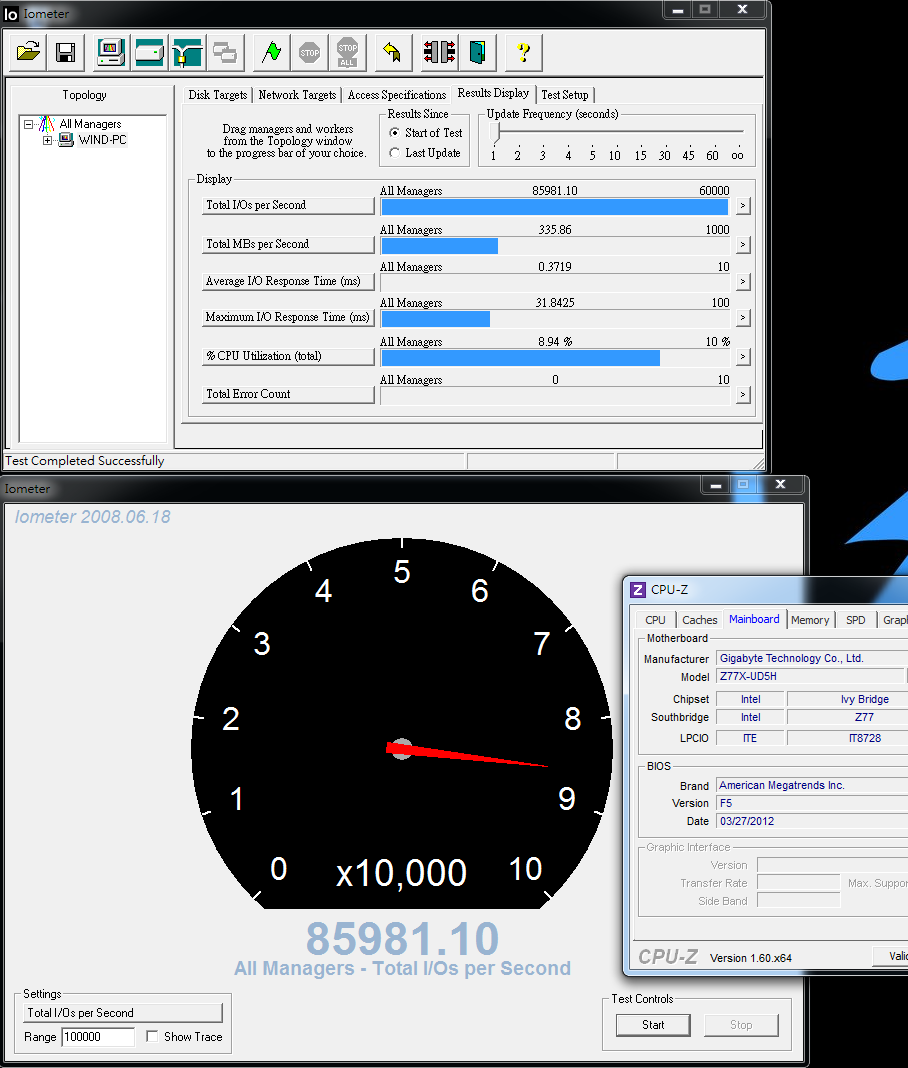 IOMETER 2008 test, you can see the first minute I/Os is extremely high. If the test keeps for 3 minutes, the I/Os becomes lower. However, its still higher than official sepc, max Random Read/Write 39K / 83K IOPS. Above-mentioned, SandForce controller has special algorithm for Sequential Write. It leads to the performance speeding. Internet said it designs for reducing writing numbers to increase SSD life. Anyway, only sequential write can achieve 500 MB/s. For random test, Write is only 180~280 MB/s. Besides this, Read or 4K is good performance level. SanDisk uses NAND Flash synchronize IC, the performance is not lower than Intel or Micron IC. SandForce controller has been in the market for a while. SanDisk SSD can have more competitive price. Second part is NoteBook test. I still use acer TimelineX 3830TG for performance test. I have been using this NB for several SSD reviews. The performance wont be impact by SATA performance. If I get Ivy Bridge NoteBook in the future, I will move to latest Intel chipset one.  3830TG color is very eye catching. The upper cover is aluminum also. The body is also slim. Intel chipset is HM65. In NoteBook, it has better SATA3 transfer ability.  SanDisk Extreme 240GB install at SATA3 as system drive. OS is Windows7 Ultimate 64bit, all drivers and Intel Smart Response Technology. HD Tune Pro 5.00 Black Size is special function of this software. Left side is default 64K and right side is 1MB. 64K - Read - Average 257.6 MB/s Access Time 0.177ms 1MB - Read - Average 492.4 MB/s Access Time 0.182ms 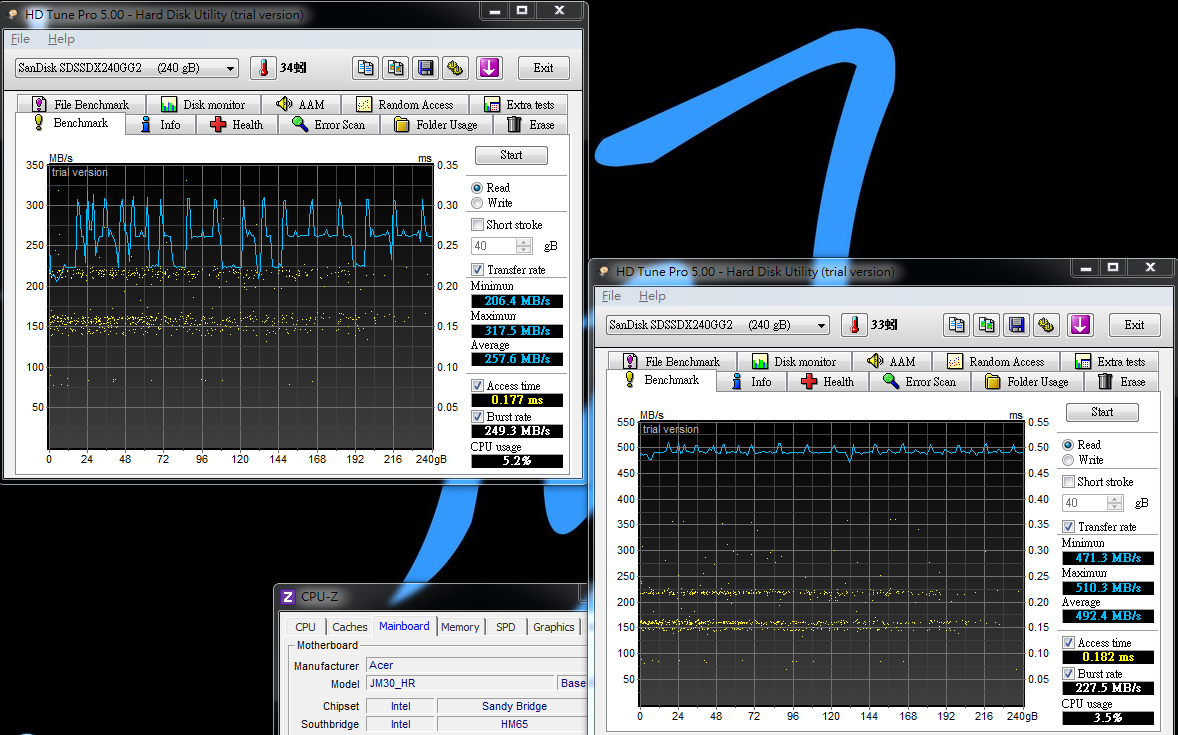 File Benchmark Sequential Read - 51068 IOPS / Write - 78802 IOPS ATTO DISK Benchmark over 1024k test, max Read is 556.6 Mb/s and Write is 527.6 MB/s. 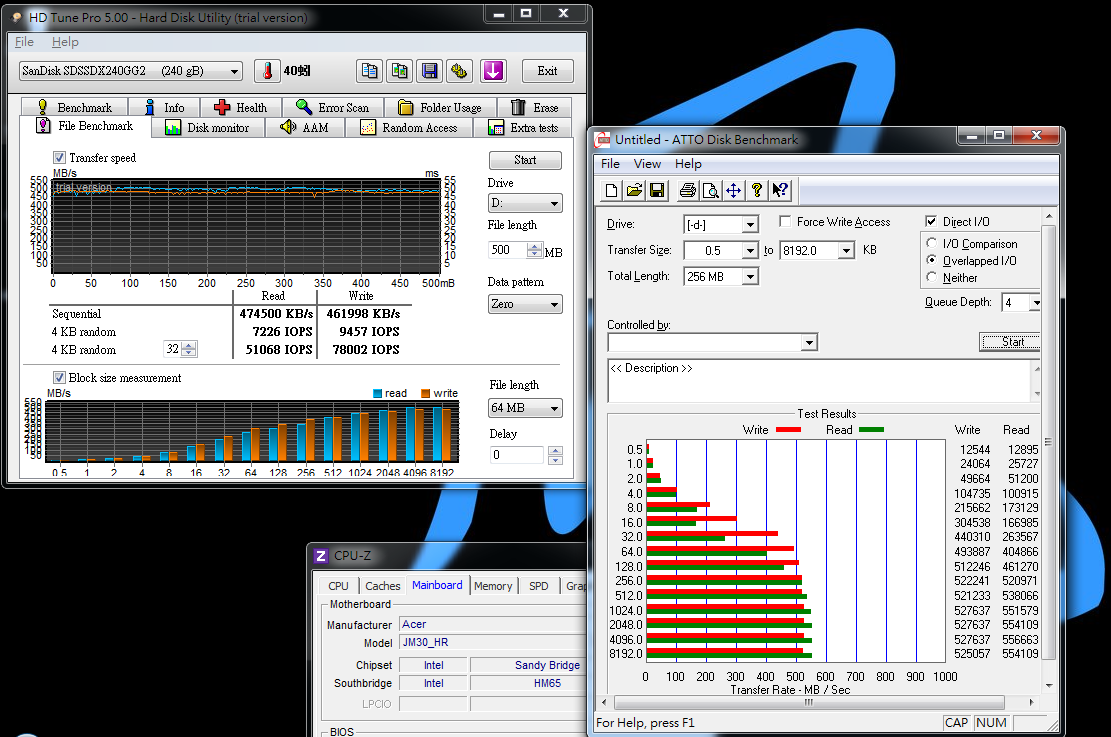 CrystalDiskMark Seq Read - 435.0 MB/s Write - 233.1 MB/s <All 0xFF, 1Fill> Read - 466.0 MB/s Write - 472.5 MB/s <All 0x00, 0Fill> Read - 474.7 MB/s Write - 472.0 MB/s 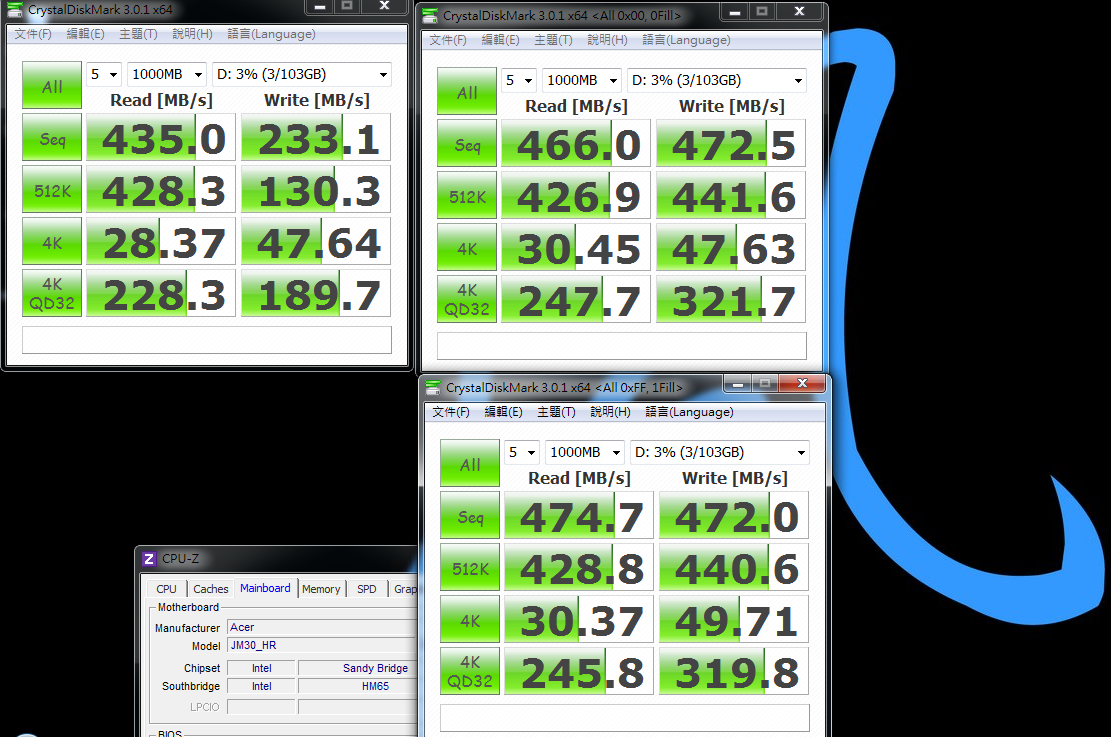 AS SSD Benchmark - 660 Seq Read - 492.39 MB/s Write - 229.45 MB/s 4K - 64Thrd Read - 214.37 MB/s Write - 179.59 MB/s 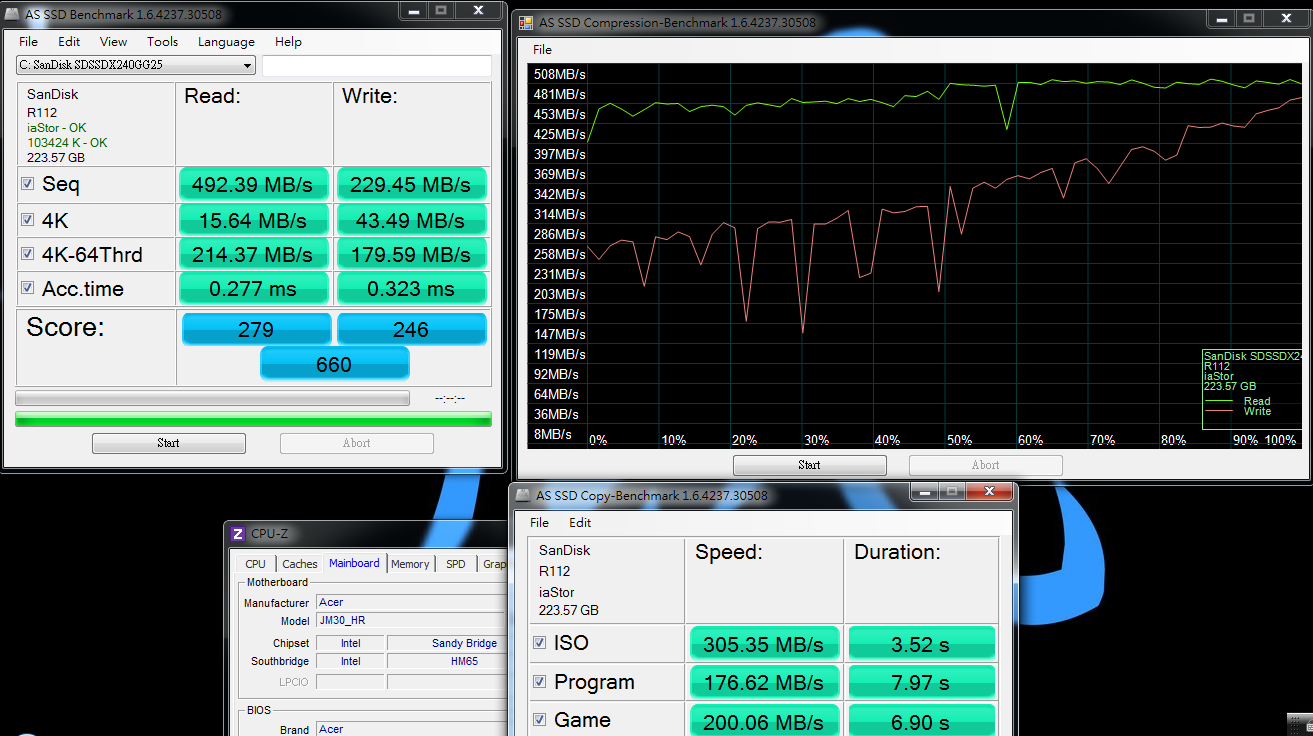 NoteBook SATA transfer rate is around 10% lower than DeskTop, especially 4K Write. 3830TG SATA3 transfer rate is lower than PC, but its still acceptable. BootRacer Time to Logon 5~6 seconds Time to Desktop 14~15 seconds 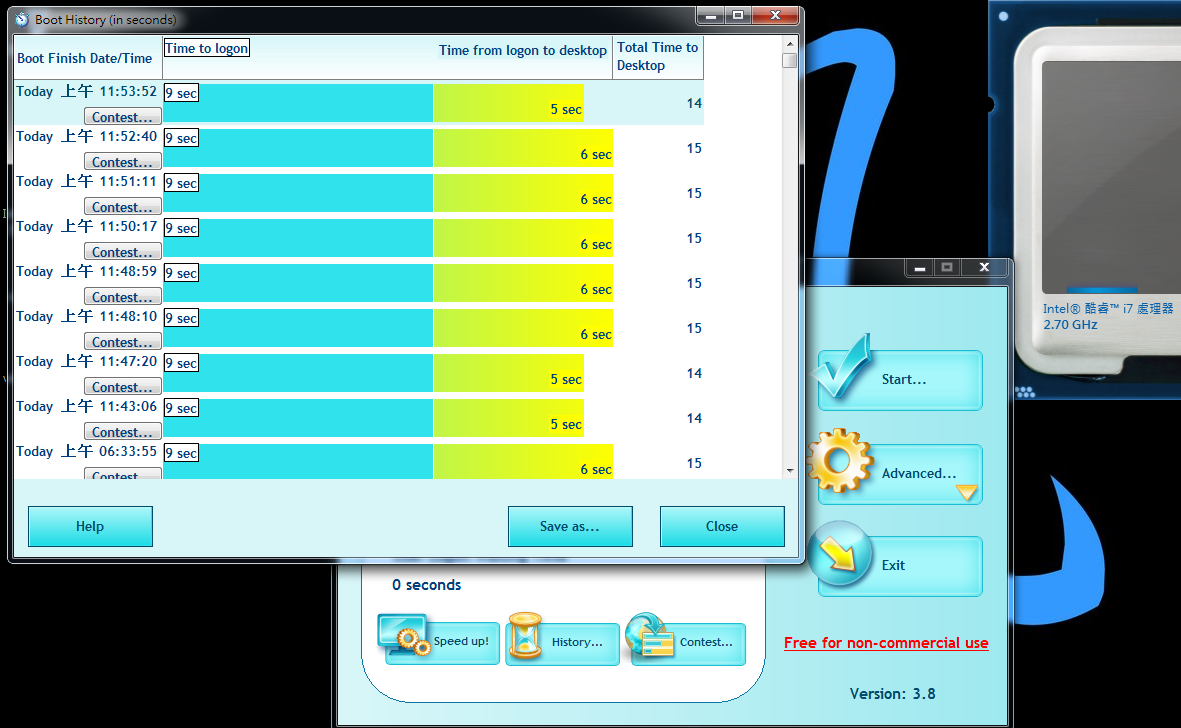 Previously, I use TOSHIBA MK6461GSY 640GB 7200, Time to Desktop was 42 seconds. SanDisk Extreme 240GB in Time to Desktop is 15 seconds. I use same NoteBook for both drives and install same drivers and software. SSD really can speed up NoteBook. SSD booting speed is 2.8 times faster than HDD. Of course, starting software is also much faster, especially you can feel for bigger files. These three years, SSD all drop price annually. It can encourage users and market to move to SSD. In 2010, 32GB was 120USD and 64GB was 220USD. Last year, 64GB was 120USD and 128GB was 220USD. This year, the market is starting to wriggle. Recently, 120/128GB and 240/256GB are starting to drop price in some regions. 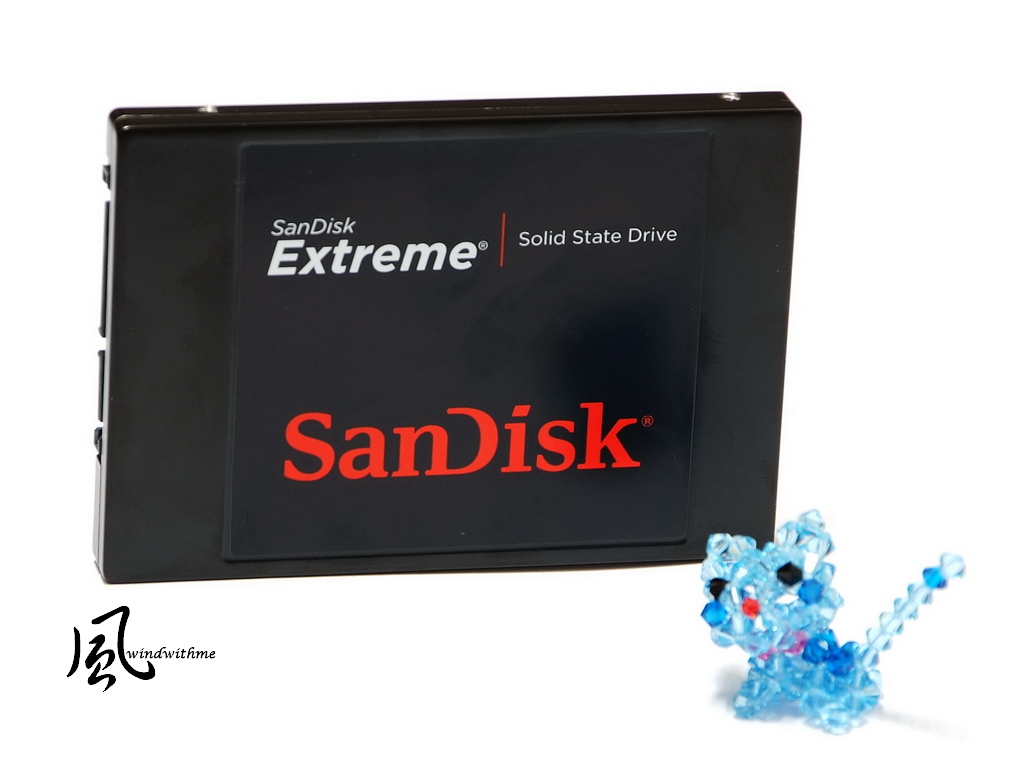 SanDisk Extreme 240GB price in Taiwan is 7800NTD, around 266USD. Using SandForce SF-2281 high speed controller and synchronize NAND Flash IC to own high performance. This cost performance can be the lowest price in same market position. SanDisk just comes into SSD market and go straight to low price and high performance product line. If they also provide good warranty and firmware upgrade, SanDisk can be a new brand with high C/P. :) This review is also in my blog WIND3C, Any comments are welcome. |
| All times are GMT +1. The time now is 20:23. |
Powered by vBulletin® - Copyright ©2000 - 2024, Jelsoft Enterprises Ltd.
Content Relevant URLs by vBSEO