
 CORSAIR Force GS 240GB Single Drive and Raid0 SSD Performance Guide
|
CORSAIR Force GS 240GB Single Drive and Raid0 SSD Performance Guide
| |||||||||
 |
 |
| | Thread Tools |
 24th January 2013, 23:28
| #1 |
| Eastern OC Expert  Join Date: Dec 2004
Posts: 1,092
 |  Solid-State Drive does improve C performance in past 4 years. No matter DeskTop PC or Notebook both shorten the system processing time. It?s why SSD still so popular after launching many years. However, the high price also impact the popularity. Every year, SSD price is almost 50% off. The price segment is based on 100 or 200USD. As history price record, 2 years ago, 200USD only could have 60GB, last year was 120GB and this year is 240GB. This year, you can find many 120GB SSD below 100USD. This price point is acceptable. 3 years ago, CORSAIR, from USA, started their SSD product line which was pioneer in this field. Controller also moved from SAMSUNG to SandForce or Marvell. Different controller focus on different performance and price segment. This GS SSD is Force Series. It had Force 3 and GT, 2 versions. Force Series uses SandForce controller with different NAND Flash ICs. Let?s look at packing first. Gold is a representative color of GS.  Contents Left side is product warranty card, middle is Force GS 240GB and right side is back 2.5? to 3.5? rack and screws.  Product size is 2.5?. The capacity is 240GB.,Official max speed is 555/525 MB/s at ATTO Disk Benchmark. Random 4K max write is 90k IOPS. It?s very high specs of 4K performance in current SSD market.  Metal shell with red coating and tactile impression is grain texture. CORSAIR offers 3 years warranty. The family has 128/180/240/360/480GB. Capacity provides rich choices. Users can choose the suitable one by budget or demand.  Back is black metal with matte hair line. It improves the product texture. Lower left is SATA3 and power connectors. Next is silver laser sticker. As warranty and internal hardware safety, we better to keep it in original state.  Force Series GS uses popular SandForce SF-2281 controller. NAND Flash uses 16 SanDisk Mark 24nm ICs, 16GB each. If you are interested in Force GS internal build, you can search in Google. The test platform is Intel Z77 chipset, GIGABYTE G1.SNIPER M3. It?s mid-end gaming series using Micro ATX. It emphasizes audio and LAN chips. It equips Creative latest CA0132, quad-core audio processor. It supports THX, CRYSTAL VOICE, and etc. 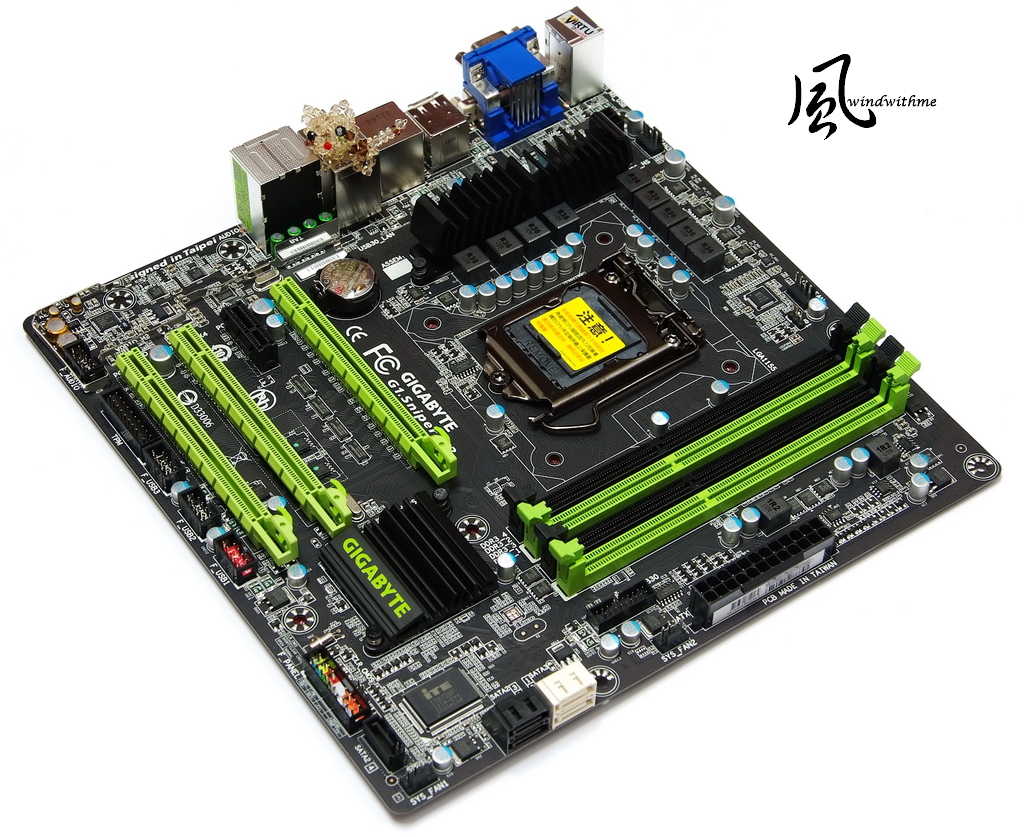 It has 3 PCI-E X16, 1 PCI-E X1. The expandability is very good as Micro ATX form factor. Also Intel chipset IO performance is better. The SATA3 should have better performance in SSD.  System Configuration CPU: Intel Core i5-3570K MB: GIGABYTE G1.SNIPER M3 DRAM: CORSAIR DOMINATOR-GT 1866 8GBX2 VGA: Intel HD Graphics 4000 HD: SanDisk Extreme 240GB / WD 1TB 7200rpm POWER: Thermaltake TR2 600W Cooler: XIGMATEK HDT-S1283 OS: Windows8 Ultimate 64bit 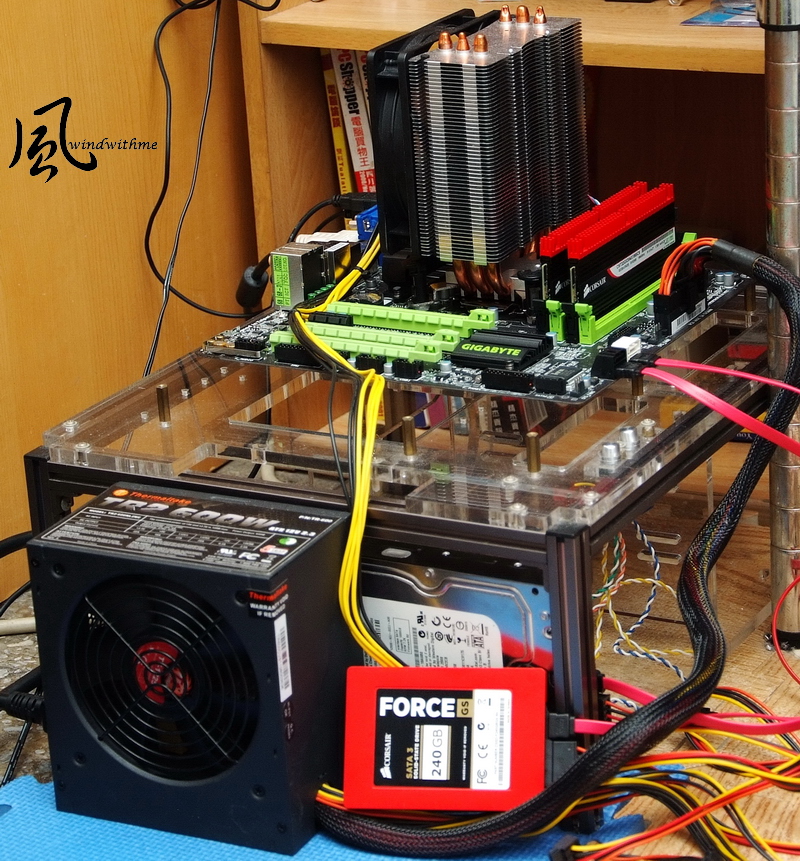 Single SanDisk Extreme 240GB install at white SATA3 port None OS system drive without any data. Test at Intel Z77 platform. HD Tune Pro 5.00 Black Size is the special part of this software. Left side default is 64K and right side is 1MB. 64K - Read - Average 408.7 MB/s Access Time 0.116ms 1MB - Read - Average 521.3 MB/s Access Time 0.117ms 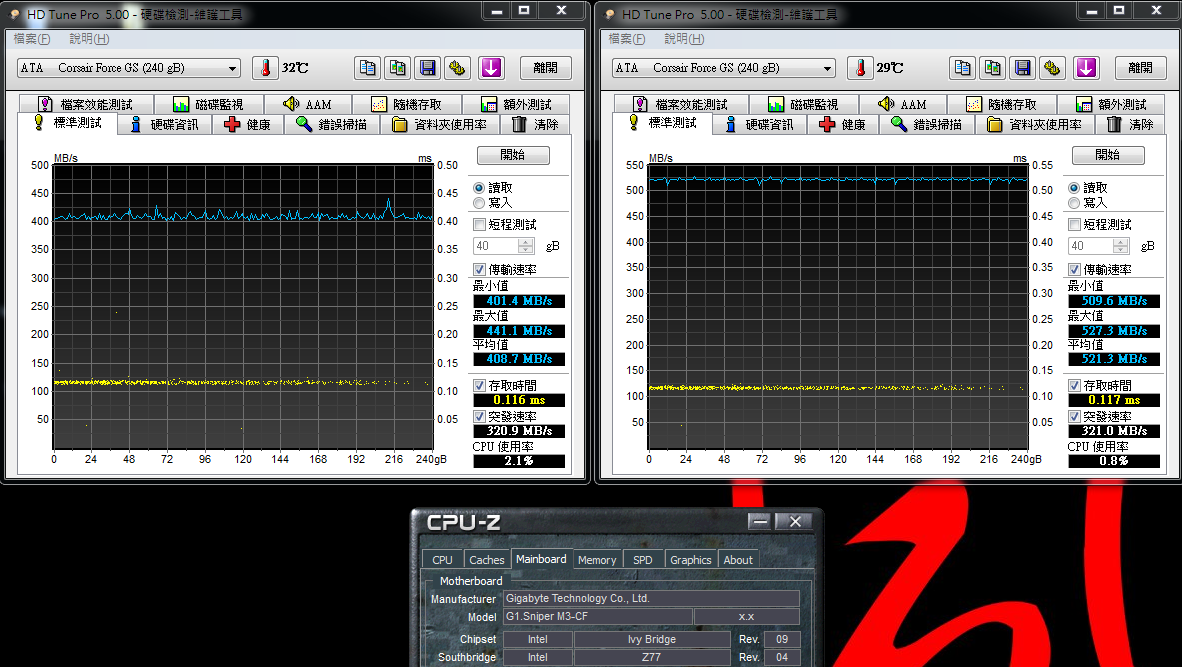 HD Tune Pro 5.00 set Black Size as 1MB almost reaching the best performance. |

|
|
24th January 2013, 23:32
| #2 |
| Eastern OC Expert Join Date: Dec 2004
Posts: 1,092
| 64K - Write - Average 336.7 MB/s Access Time 0.143ms 1MB - Write - Average 331.4 MB/s Access Time 0.108ms  Read - Random Access & Extra tests 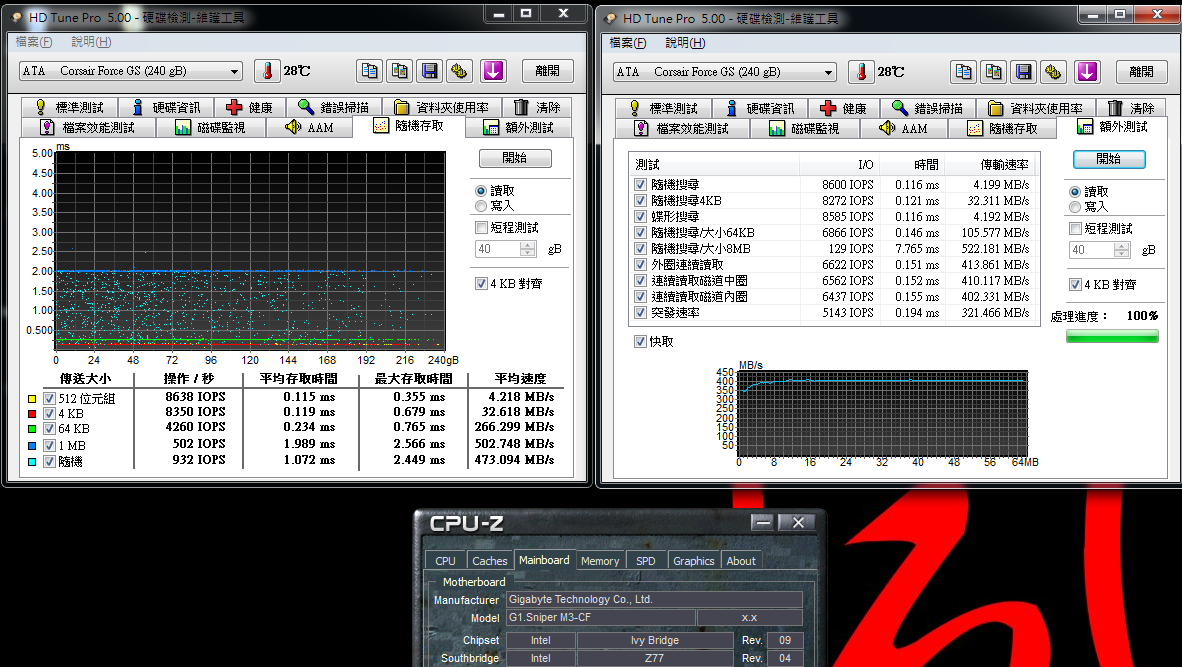 Write - Random Access & Extra tests  File Benchmark Sequential 4KB randon Read - 66732 IOPS / Write - 91984 IOPS ATTO DISK Benchmark over 512KB test, max read is 557.9 Mb/s and max write is 535.6 MB/s  CrystalDiskMark Seq Read - 524.1 MB/s Write - 288.7 MB/s <All 0xFF, 0Fill> Read - 527.4 MB/s Write - 524.9 MB/s <All 0x00, 1Fill> Read - 527.6 MB/s Write - 525.1 MB/s 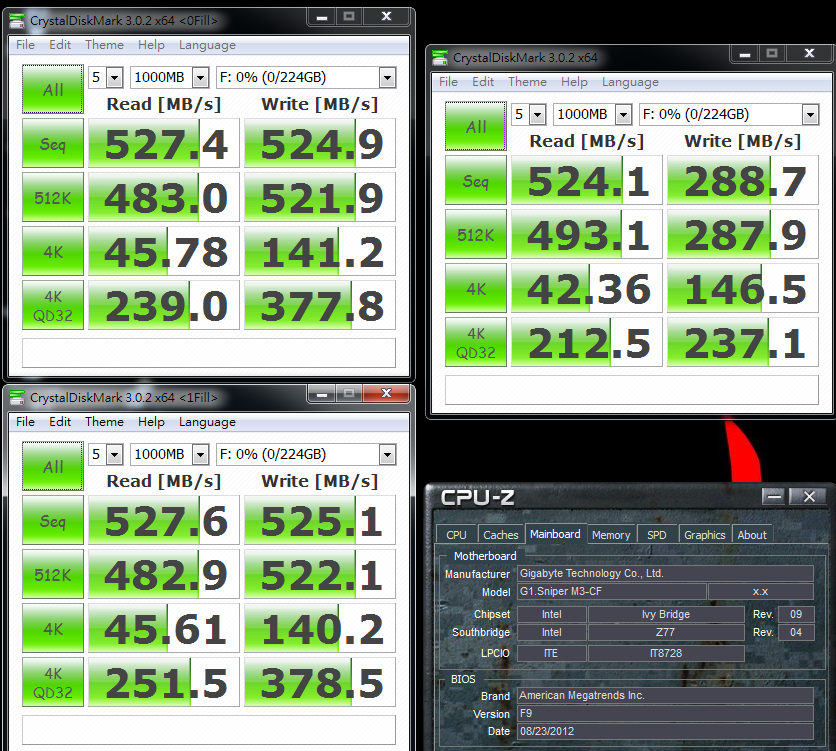 CrystalDiskMark default test is random. You can see right side performance is lower. It?s characteristic of SandForce controller. It has lower performance in random algorithm. Left pic is CrystalDiskMark sequential mode. The write performance is close to official specs. AS SSD Benchmark - 811 Seq Read - 519.43 MB/s Write - 274.13 MB/s 4K - 64Thrd Read - 224.70 MB/s Write - 214.04 MB/s  AS SSD Benchmark Seq Write is similar to CrystalDiskMark. Compression Benchmark write starts from 280MB/s to over 480MB/s. SandForce in Sequential Write uses special algorithm, this is key weakness of SandForce controller. In sequential or random read, 4K performance and continuous write, SF-2281 controller is very good. PCMark Vantage - HDD Score : 78671 CrystalMark Sequential Read 503.02 MB/s Sequential Write 500.48 MB/s  IOMETER 2008 1 minute - 100% Read / 100% Random 4KB Total I/Os per Second => 55773.68 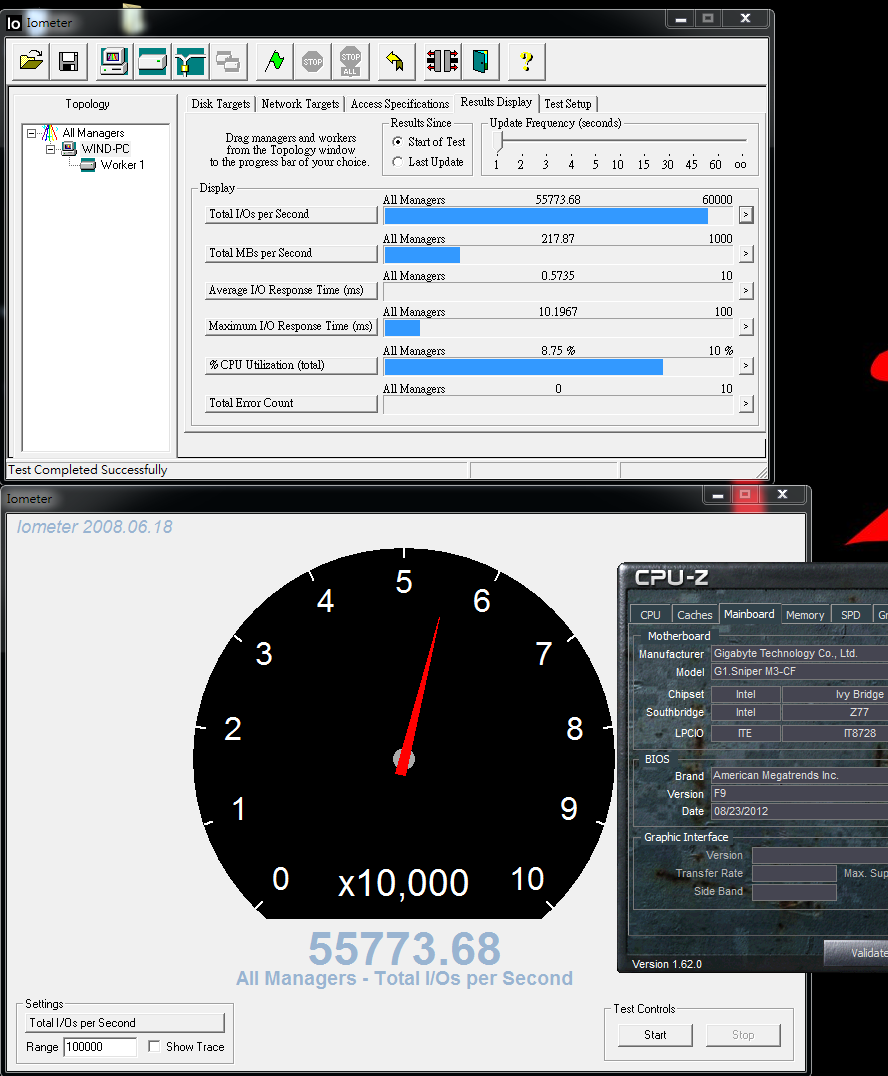 3 minutes - 100% Read / 100% Random 4KB Total I/Os per Second => 56190.92 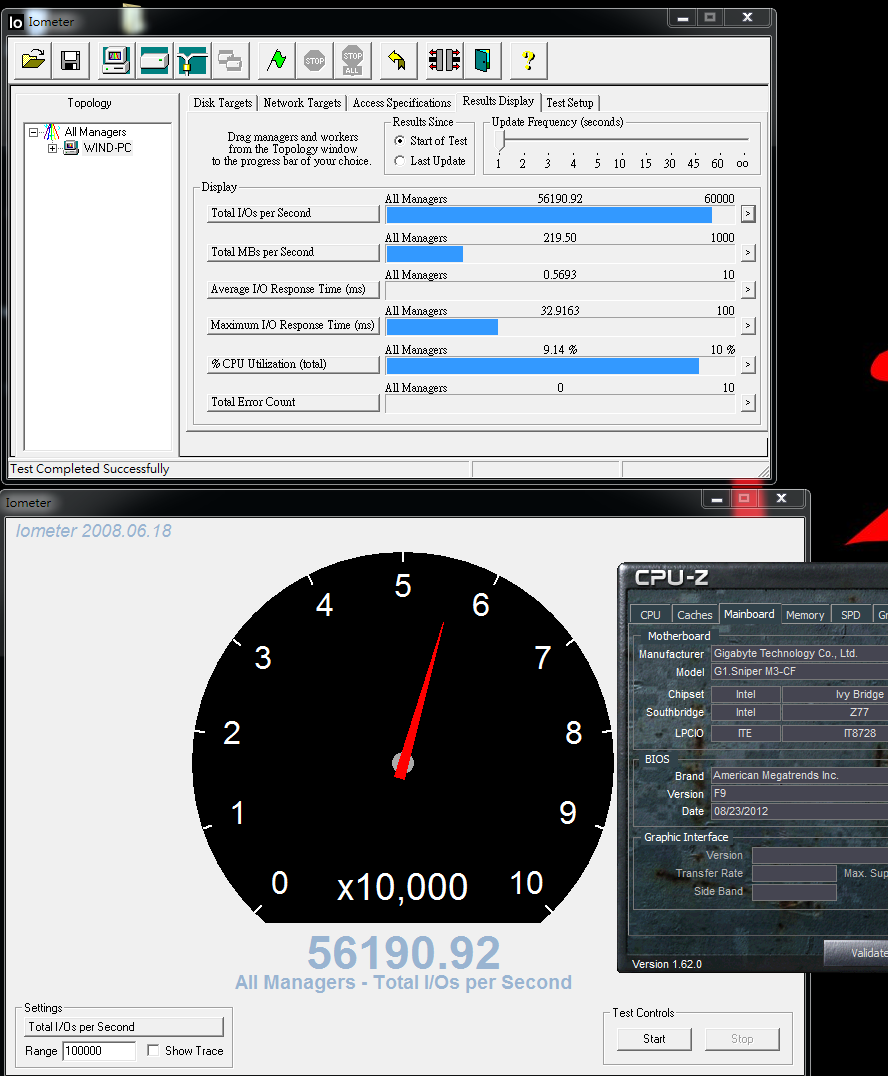 1 minute - 100% Write / 100% Random 4KB Total I/Os per Second => 91791.99  |
|
|
|
24th January 2013, 23:36
| #3 |
| Eastern OC Expert Join Date: Dec 2004
Posts: 1,092
| 3 minutes - 100% Write / 100% Random 4KB Total I/Os per Second => 91553.28  The former review of SandForce SSD, the performance is lower after 3 minutes. It may be caused by firmware. As GS using SandForce controller, IOMETER 2008 Random Read / Write 4KB test are very good. 1 minute and 3 minutes test difference is minor. You can treat it as acceptable deviation. SSD Benchmark TOTAL => 5026.30  This result is much higher than 3700 by Marvell 88SS9174-BKK2 controller SS. You can see SandForce controller SSD still has his advantage in some software. Second part is two 240GB GS runs at Raid 0 mode. 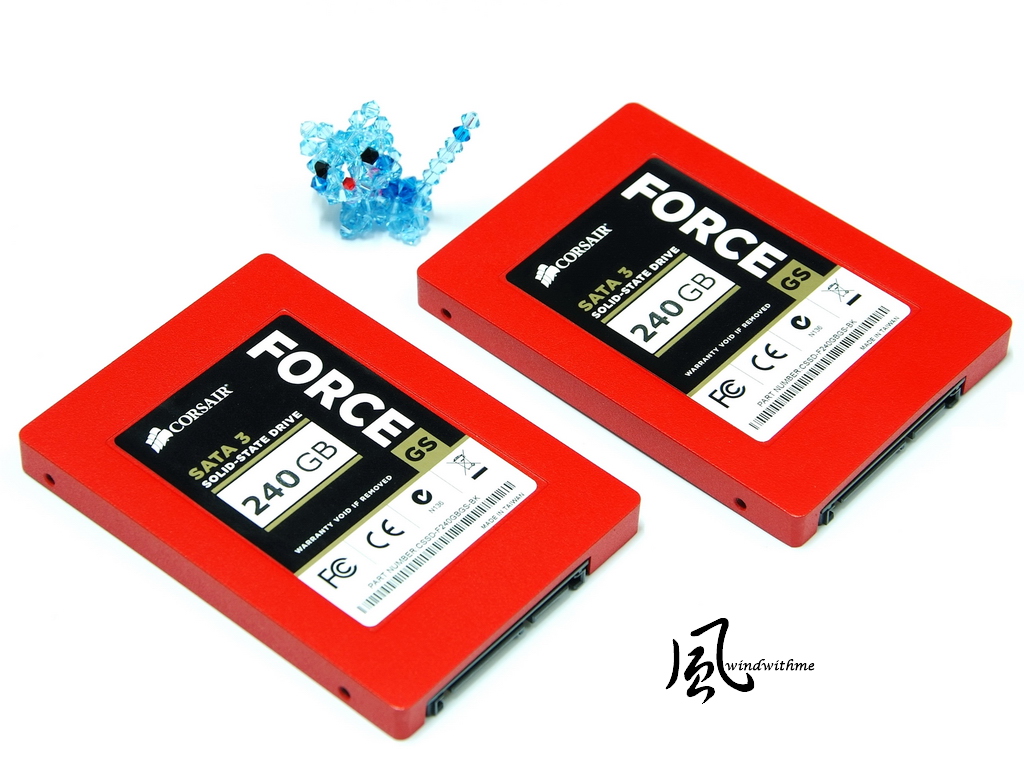 Two CORSAIR Force GS 240GB both install at white SATA3 port. None OS system drive without any data. Test at Intel Z77 platform. HD Tune Pro 5.00 Black Size is the special part of this software. Left side default is 64K and right side is 8MB. 64K - Read - Average 1028.7 MB/s Access Time 0.123ms 8MB - Read - Average 1040.1 MB/s Access Time 0.122ms 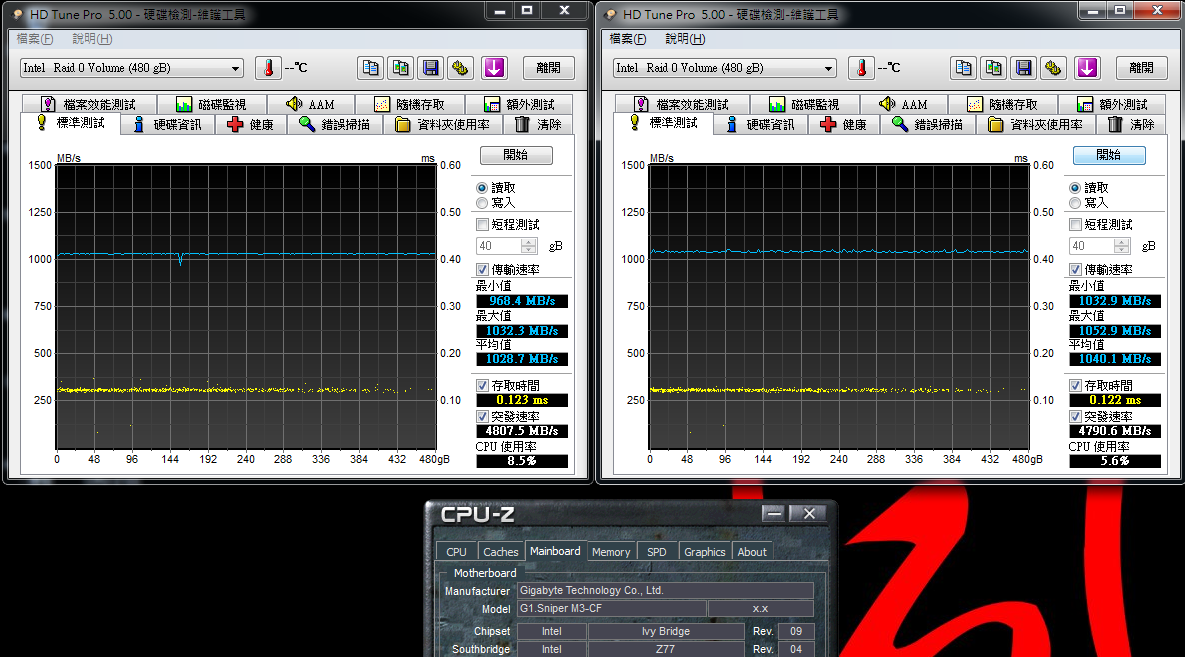 64K - Write - Average 325.8 MB/s Access Time 0.094ms 8MB - Write - Average 891.9 MB/s Access Time 0.153ms  Read - Random Access & Extra tests 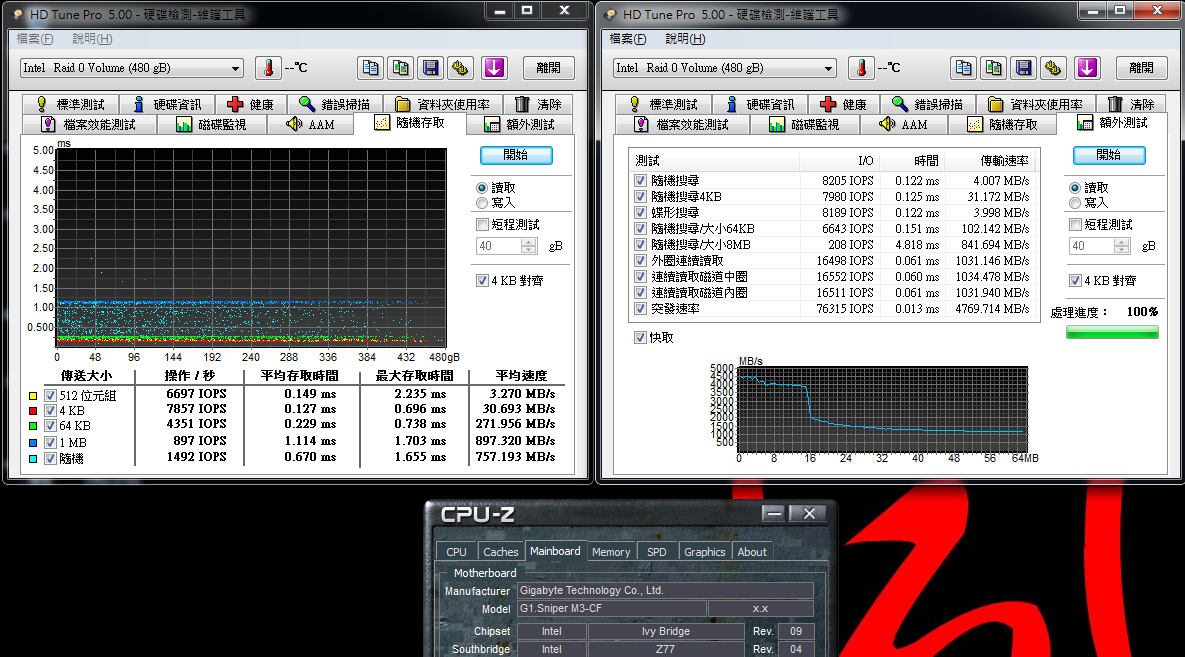 Write - Random Access & Extra tests 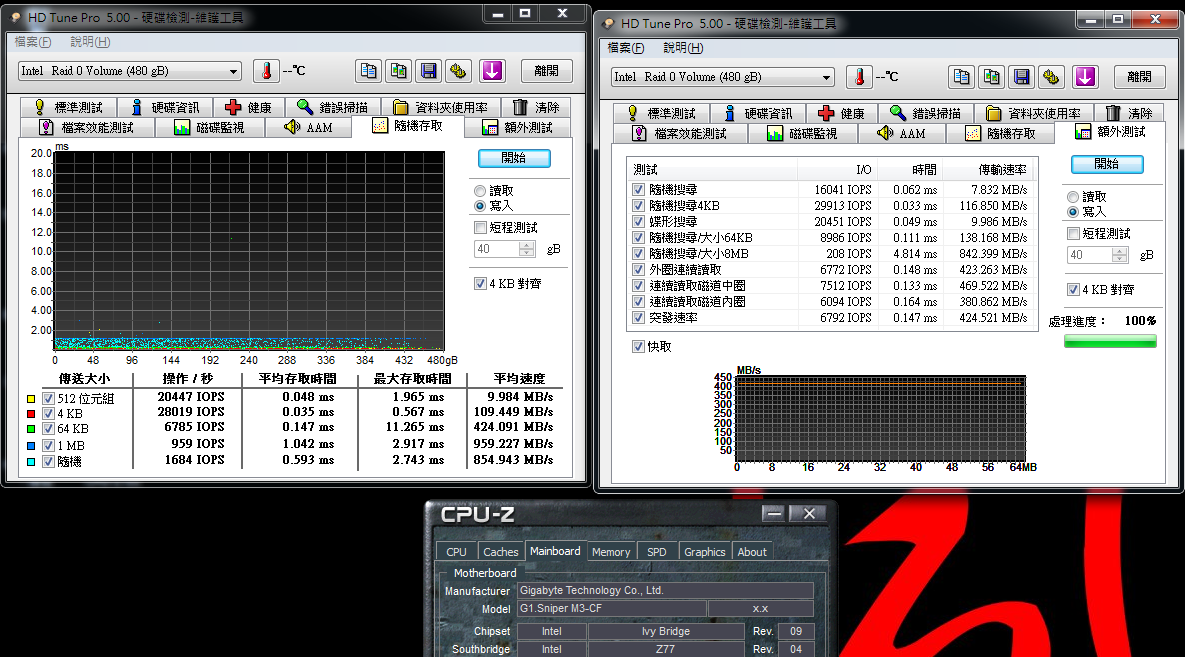 File Benchmark Sequential 4KB randon Read - 84750 IOPS / Write - 169440 IOPS ATTO DISK Benchmark over 128KB test, max read is 1118.4 Mb/s and max write is 1047.5 MB/s  CrystalDiskMark Seq Read - 1012 MB/s Write - 529.9 MB/s <All 0xFF, 0Fill> Read - 1064 MB/s Write - 993.1 MB/s <All 0x00, 1Fill> Read - 1063 MB/s Write - 875.5 MB/s  HD Tune Pro 5.00 most items are almost double speed. CrystalDiskMark scores are also the same. ATTO DISK Benchmark is a good software to test SSD best read/write performance with short time. The max score is almost double as well. You can see the Raid 0 mode really improves the performance. AS SSD Benchmark - 1423 Seq Read - 1031.05 MB/s Write - 517.00 MB/s 4K - 64Thrd Read - 456.30 MB/s Write - 407.31 MB/s  In Raid 0 mode, AS SSD Benchmark score increases about 75%. |
|
|
|
24th January 2013, 23:41
| #4 |
| Eastern OC Expert Join Date: Dec 2004
Posts: 1,092
| PCMark Vantage - HDD Score : 77278 CrystalMark Sequential Read 1045.61 MB/s Sequential Write 940.61 MB/s  PCMark Vantage HDD Score is same as single drive. I think it?s software issue. CrystalMark still has almost double speed. IOMETER 2008 1 minute - 100% Read / 100% Random 4KB Total I/Os per Second => 75398.85 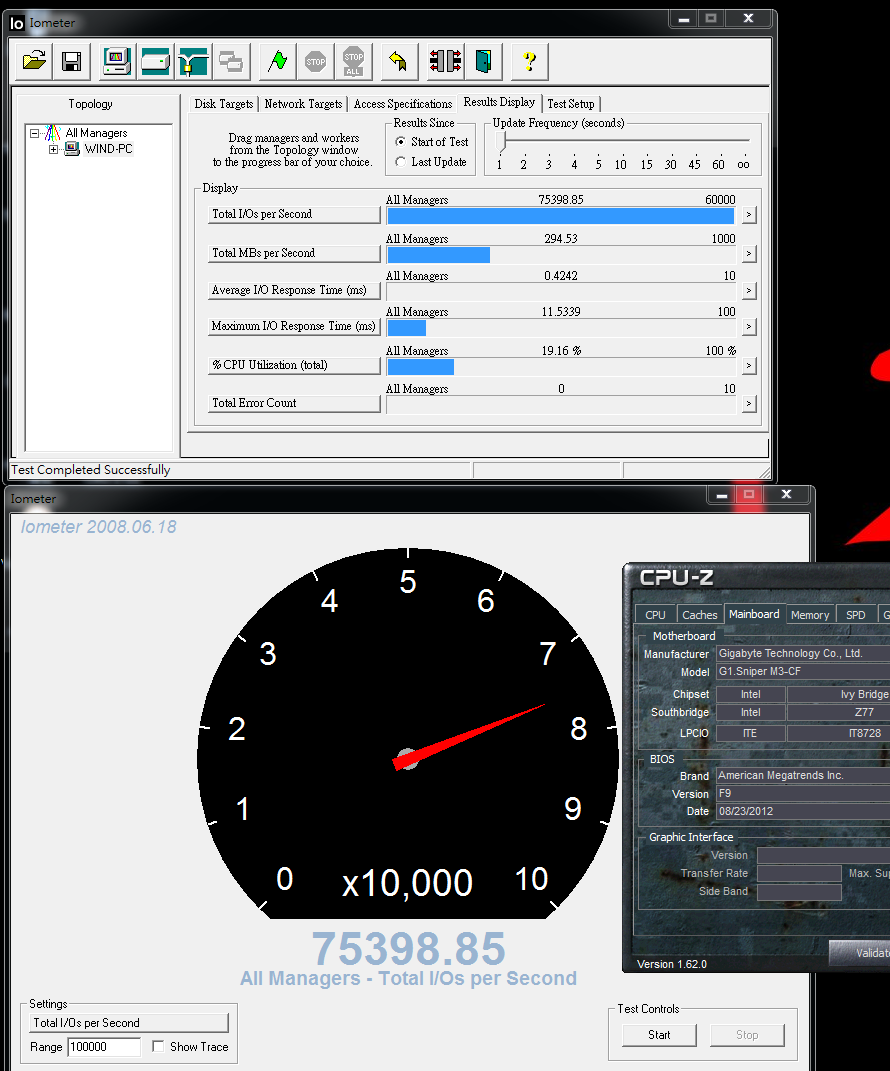 3 minutes - 100% Read / 100% Random 4KB Total I/Os per Second => 68926.28  IOMETER 2008 Random Read 4KB increases 24~35%. 1 minute to 3 minutes later, the performance drops 9%. 1 minute - 100% Write / 100% Random 4KB Total I/Os per Second => 112569.77  3 minutes - 100% Write / 100% Random 4KB Total I/Os per Second => 112823.49 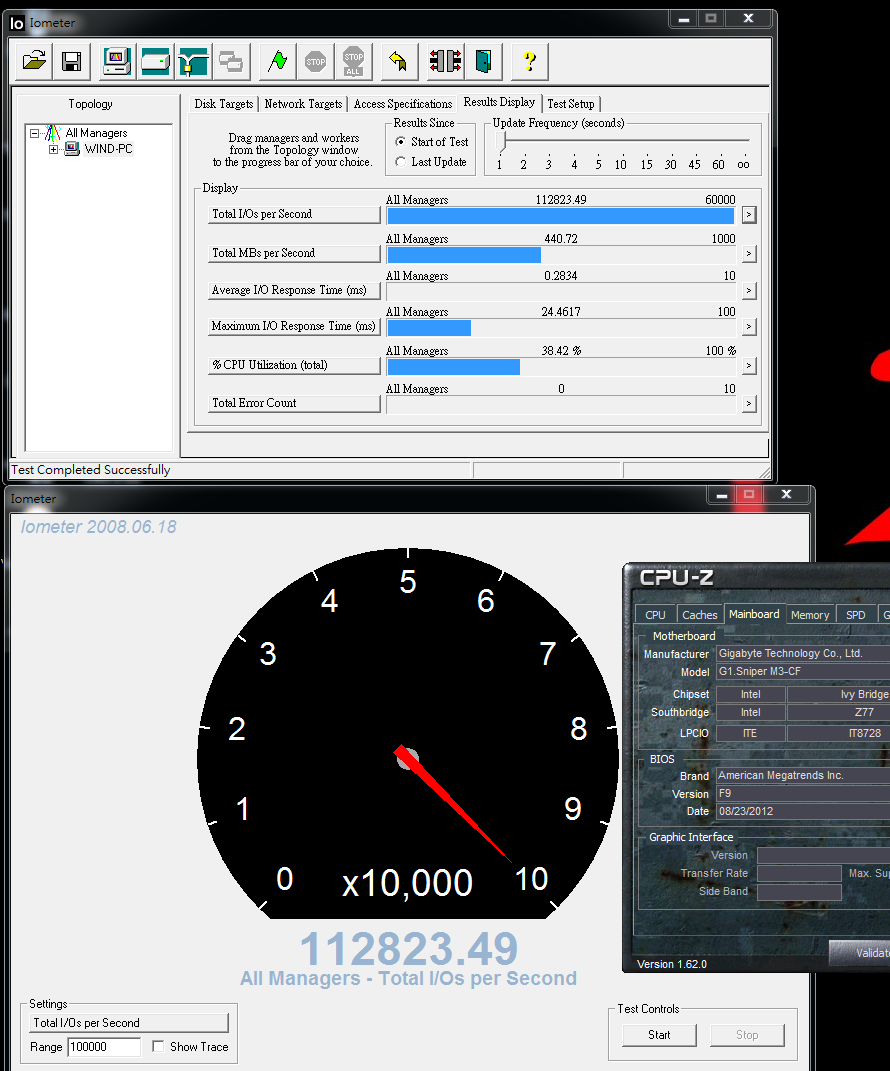 IOMETER 2008 Random Write 4KB increases about 23%. SSD Benchmark TOTAL => 7455.18 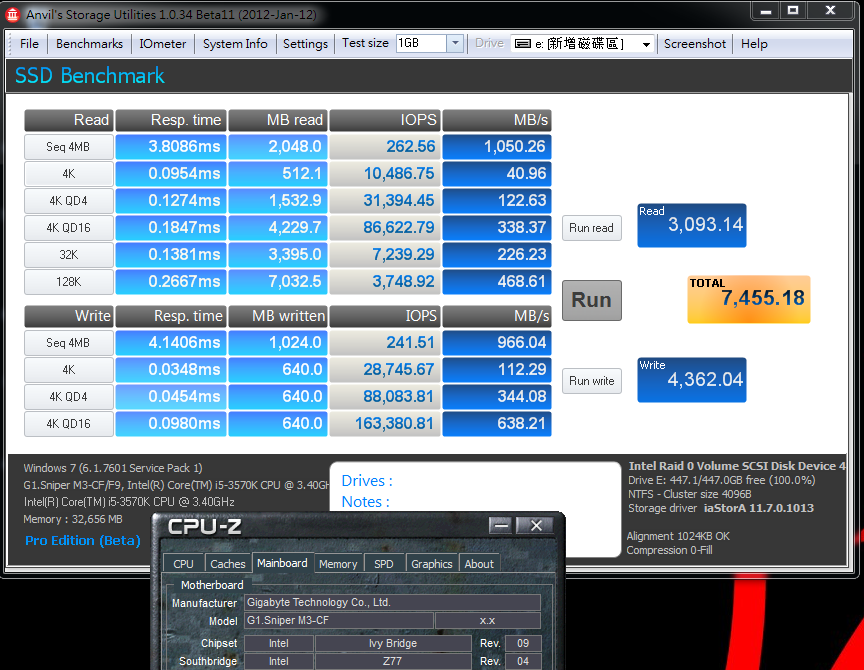 This software also increases 48%. Windwithme mentioned several times when sharing SSD Raid 0 test. That moment, Intel Rapid Storage Technology didn?t support Raid 0 Trim mode. So the speed would drop after using for long time. Few months ago, Storage Technology Drive 11.5 released and official support Raid 0 Trim. This is really a good news for Raid 0 mode users. It also pushes SSD further performance and applications to wider range. 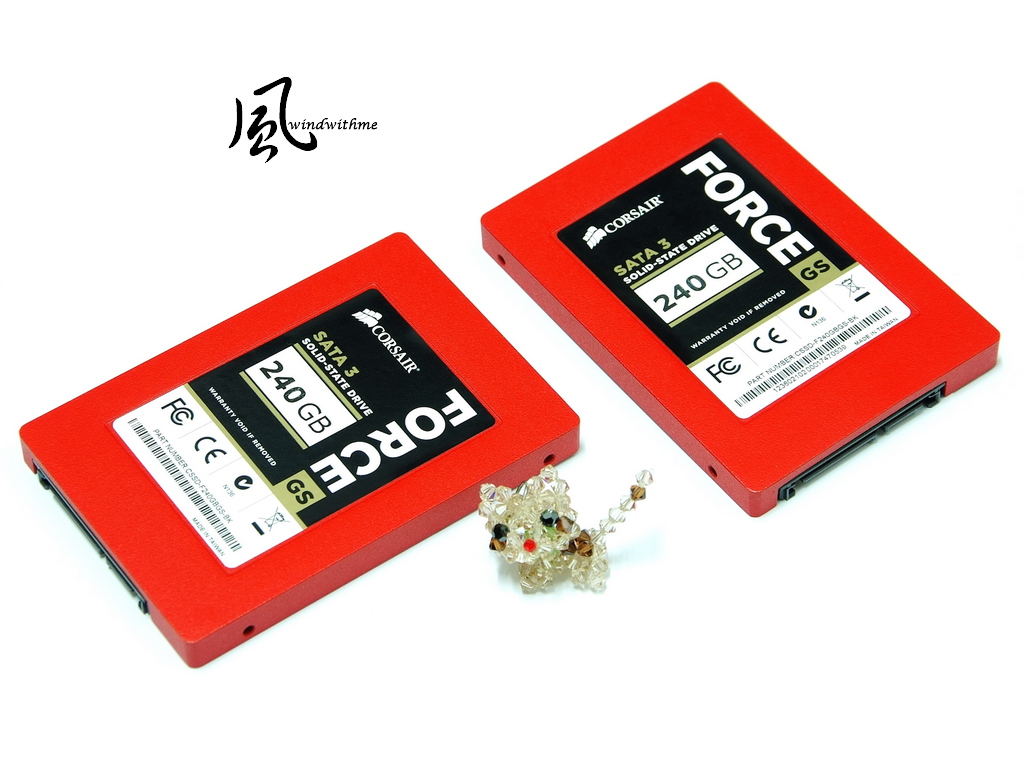 SandForce SF-2281 controller has been launched over 18 months. From high end SATA3 SSD position to current 80% market share, the price is close to entry SATA3 SSD. As different service terms and warranty, the price is different. Popularity and price is SandForce strength. The weakness is random write beginning is risng from 200 more MB/s to 500 MB/s slowly. This time, CORSAIR Force GS uses different NAND Flash ICs. Some performance is improved a little. As Max Random 4k Write (IOMeter 08) over 90k IOPS (4k aligned) is the major improvement. This article shares you the different performance of SandForce SF-2281 controller with different NAND Flash. Also, Intel Rapid Storage Technology Drive high performance in Raid 0 mode. You can use it as your reference for further SSD purchasing.  This article is also in my blog - WIND3C, Any comments are welcome. |
|
|
|
25th January 2013, 07:32
| #5 | ||
| Madshrimp  Join Date: May 2002 Location: 7090/Belgium
Posts: 79,021
 | Quote:
Quote:
*HDTAch benchmark full random IO write to the RAID 0 array re-run *HDTach benchmark re-peat full random IO write re-run *HDTach benchmark if TRIM is working on the RAID 0 performance should remain +/- consistent, if it's not working then performance will degrade quickly. *HDTach http://www.majorgeeks.com/HDTach_d672.html
__________________  | ||
|
|
|
 Similar Threads
 | ||||
| Thread | Thread Starter | Forum | Replies | Last Post |
| Corsair Force GT 240GB RAID SSD Review @ RWLabs | Stefan Mileschin | WebNews | 0 | 29th November 2012 08:24 |
| SandForce TRIM Issue & Corsair Force Series GS (240GB) Review | Stefan Mileschin | WebNews | 0 | 23rd November 2012 07:13 |
| Corsair Force GS 240GB SSD | jmke | WebNews | 0 | 29th August 2012 08:18 |
| Corsair Force GS 240GB RAID Review @ RWLabs | Stefan Mileschin | WebNews | 0 | 21st August 2012 07:36 |
| Corsair Force GS 240GB SSD Review @ RWLabs | Stefan Mileschin | WebNews | 0 | 30th July 2012 09:25 |
| Corsair Force GS 240GB Review @ Vortez | Stefan Mileschin | WebNews | 0 | 26th July 2012 07:24 |
| Corsair Force GT 240GB SSD Review @ RWLabs | Stefan Mileschin | WebNews | 0 | 2nd July 2012 11:04 |
| Corsair 240GB Force GT RAID0 Review | Stefan Mileschin | WebNews | 0 | 5th January 2012 06:18 |
| Corsair Force GT 240GB Solid State Drive Review | Stefan Mileschin | WebNews | 0 | 3rd October 2011 13:21 |
| Corsair Force F40 RAID0 | jmke | WebNews | 0 | 23rd December 2010 16:48 |
| Thread Tools | |
| |


